


How much do AI platforms use local websites as citation sources when answering questions in different markets? How much does this change between ChatGPT, AI Mode and Gemini?
The main finding is that local domains (.br, .uk and .es) represent 41.4% of citations in Brazil, 38.3% in the UK and 24.0% in Spain. The platform with the highest local share varies by country, and the share also differs by topic.
I’ve analyzed the citations used by ChatGPT, Gemini and AI Mode across ten topics in the US, UK, Spain and Brazil markets for the same prompts library localized for each market, with the goal was to understand which sources appear in each, how much the platforms differ, and what this means for international AI search optimization.
To easily identify local citation shares for each country, I used their ccTLDs (.uk for the UK, .es for Spain and .br for Brazil) as a consistent indicator of country targeting, although it’s understood this might not show all locally targeted citation sources, as some will likely also use gTLDs such as .com or .org to target them, however, it provides the clearest targeting signal to each.
The Key Findings
Let’s go through the most important international citations patterns identified in the analysis across these markets:
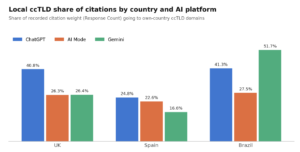
- Platform differences depend on the market: ChatGPT has the highest local ccTLD share in the UK and Spain. Gemini leads in Brazil at 51.7%, but has the lowest share in Spain at 16.6%. AI Mode varies less across the 3 markets, from 22.6% to 27.5%.
- The topic split changes by country: Personal finance, home and DIY, and automotive have the highest local shares in each country. The country / topic tables show both local and non-local shares before the platform detail.
- Google and YouTube change the AI Mode comparison: These domains account for 19–45% of its citations. When they’re excluded, AI Mode has the highest local share in the UK and Spain.
- Source types help explain the platform differences: Institutional sources (government, public service, academic and financial organizations identified through domain patterns) represent for 31-46% of ChatGPT’s local citation share. However, it accounts for a smaller share of AI Mode’s and Gemini’s local citations.
- Page overlap is significantly lower than domain overlap: ChatGPT has the highest citation overlap with its own US domains in the UK and Spain; AI Mode leads in Brazil. Normalized URL overlap is much lower, ranging from 1.7% to 35.7% across the nine platform / market combinations.
1. Local vs non-local citation share by country
Let’s start with many of each country’s citations comes from its own ccTLDs: Non-local domains still account for the higher share of citations in all 3 countries, with Brazil showing the highest local share at 41.4%, followed by the UK at 38.3%. Spain has the lowest at 24.0%: nearly one in four citations comes from a .es domain.
Although is true that most of citations come from gTLDs, the share of ccTLDs is already important, and not to be overlooked when looking to maximize a brand AI visibility in an international market.
| Country | Local citations | Non-local citations |
|---|---|---|
| UK | 38.3% | 61.7% |
| Spain | 24.0% | 76.0% |
| Brazil | 41.4% | 58.6% |
Also, remember that this doesn’t mean that the remaining citations are in English or irrelevant to the country. Generic domains can publish local content.
2. Local vs non-local citation share by country and AI platform
In the UK, ChatGPT has the highest local share at 40.8%, AI Mode and Gemini are almost identical at 26.3% and 26.4% and in Spain, ChatGPT also leads at 24.8%, followed by AI Mode at 22.6% and Gemini at 16.6%.
Brazil follows a different pattern: Gemini leads at 51.7%, followed by ChatGPT at 41.3% and AI Mode at 27.5%. Brazil’s Gemini results are the only country / platform combination where local citations surpass non-local ones.
There isn’t a platform with the highest local share in every country: AI Mode varies the least, from 22.6% to 27.5%. Gemini varies the most, from 16.6% in Spain to 51.7% in Brazil. This is why each market needs its own platform comparison.
| Country | AI platform | Local citations | Non-local citations |
|---|---|---|---|
| UK | ChatGPT | 40.8% | 59.2% |
| UK | AI Mode | 26.3% | 73.7% |
| UK | Gemini | 26.4% | 73.6% |
| Spain | ChatGPT | 24.8% | 75.2% |
| Spain | AI Mode | 22.6% | 77.4% |
| Spain | Gemini | 16.6% | 83.4% |
| Brazil | ChatGPT | 41.3% | 58.7% |
| Brazil | AI Mode | 27.5% | 72.5% |
| Brazil | Gemini | 51.7% | 48.3% |
3. Local vs non-local citation share by country and topic
Which topics use more local sources in each country? The table below shows the 3 platforms separately for each country and topic, featuring local share first and non-local share second:
- Personal finance, home and DIY, and automotive have the three highest local shares in every country, although their order changes. Home and DIY leads in the UK at 66.3%. Personal finance leads in Spain at 59.4% and Brazil at 78.7%.
- Local domains provide the majority of citations in three UK topics, two Spain topics and three Brazil topics. In all remaining topics, non-local domains provide the majority.
- B2B software and SaaS has a low local share in all three countries: 14.3% in the UK, 10.5% in Spain and 15.9% in Brazil.
| Topic | UK Local / non-local |
Spain Local / non-local |
Brazil Local / non-local |
|---|---|---|---|
| Personal Finance | 58.1% / 41.9% | 59.4% / 40.6% | 78.7% / 21.3% |
| Home & DIY | 66.3% / 33.7% | 52.9% / 47.1% | 60.1% / 39.9% |
| Automotive | 61.5% / 38.5% | 38.0% / 62.0% | 63.6% / 36.4% |
| Travel | 35.6% / 64.4% | 23.2% / 76.8% | 43.4% / 56.6% |
| Fashion & Clothing | 34.4% / 65.6% | 18.4% / 81.6% | 48.8% / 51.2% |
| Sport & Fitness | 29.3% / 70.7% | 12.8% / 87.2% | 33.9% / 66.1% |
| Health & Wellbeing | 45.2% / 54.8% | 2.8% / 97.2% | 17.3% / 82.7% |
| Consumer Electronics | 20.2% / 79.8% | 12.2% / 87.8% | 30.2% / 69.8% |
| Beauty & Skincare | 28.4% / 71.6% | 9.4% / 90.6% | 21.7% / 78.3% |
| B2B Software / SaaS | 14.3% / 85.7% | 10.5% / 89.5% | 15.9% / 84.1% |
4. Local vs non-local citation share by country, topic and AI platform
Let’s now see the platforms local vs non-local citation share in each country for the ten analyzed topics:
UK by topic and AI platform
ChatGPT has the highest local share in eight of the ten UK topics. AI Mode is slightly higher for personal finance and higher for health, but both of those AI Mode segments have fewer than 100 recorded associations.
The clearest differences include fashion: ChatGPT’s local share is 38.8%, compared with 9.8% for AI Mode and 9.2% for Gemini. Home and DIY also differs, at 70.1% for ChatGPT versus approximately 48% for AI Mode and Gemini.
| Topic | ChatGPT Local / non-local |
AI Mode Local / non-local |
Gemini Local / non-local |
|---|---|---|---|
| Personal Finance | 61.2% / 38.8% | 61.6% / 38.4%* | 39.0% / 61.0% |
| Home & DIY | 70.1% / 29.9% | 48.1% / 51.9% | 47.8% / 52.2% |
| Automotive | 63.2% / 36.8% | 55.6% / 44.4% | 54.1% / 45.9% |
| Travel | 38.2% / 61.8% | 32.8% / 67.2% | 24.8% / 75.2% |
| Fashion & Clothing | 38.8% / 61.2% | 9.8% / 90.2% | 9.2% / 90.8% |
| Sport & Fitness | 33.3% / 66.7% | 13.5% / 86.5% | 9.5% / 90.5% |
| Health & Wellbeing | 45.3% / 54.7% | 57.5% / 42.5%* | 34.3% / 65.7% |
| Consumer Electronics | 22.4% / 77.6% | 14.0% / 86.0% | 11.8% / 88.2% |
| Beauty & Skincare | 30.7% / 69.3% | 10.5% / 89.5% | 21.8% / 78.2% |
| B2B Software / SaaS | 15.4% / 84.6% | 11.9% / 88.1% | 7.2% / 92.8% |
Spain by topic and AI platform
ChatGPT has the highest local share for personal finance, home and DIY, automotive, and sport and fitness. AI Mode leads in fashion, travel, health, beauty and SaaS, and Gemini leads only in consumer electronics.
Personal finance has a large gap: ChatGPT is 62.7% local, compared with 30.4% for AI Mode and 22.4% for Gemini. In beauty, AI Mode is higher at 23.7%, versus 8.3% for ChatGPT and 10.8% for Gemini.
| Topic | ChatGPT Local / non-local |
AI Mode Local / non-local |
Gemini Local / non-local |
|---|---|---|---|
| Personal Finance | 62.7% / 37.3% | 30.4% / 69.6% | 22.4% / 77.6% |
| Home & DIY | 54.8% / 45.2% | 30.6% / 69.4% | 29.9% / 70.1% |
| Automotive | 39.2% / 60.8% | 30.7% / 69.3% | 32.5% / 67.5% |
| Travel | 23.4% / 76.6% | 29.4% / 70.6% | 18.7% / 81.3% |
| Fashion & Clothing | 19.2% / 80.8% | 20.0% / 80.0% | 10.5% / 89.5% |
| Sport & Fitness | 13.1% / 86.9% | 10.7% / 89.3% | 11.2% / 88.8% |
| Health & Wellbeing | 2.5% / 97.5% | 17.0% / 83.0%* | 10.0% / 90.0%* |
| Consumer Electronics | 11.4% / 88.6% | 12.0% / 88.0% | 17.4% / 82.6% |
| Beauty & Skincare | 8.3% / 91.7% | 23.7% / 76.3% | 10.8% / 89.2% |
| B2B Software / SaaS | 10.4% / 89.6% | 15.7% / 84.3% | 9.4% / 90.6% |
Brazil by topic and AI platform
Gemini has the highest local share in eight of the ten Brazil topics. ChatGPT leads in personal finance at 80.0%, while AI Mode leads in travel at 46.9%.
Beauty show how much the platforms can differ: Gemini is 60.0% local, compared with 18.5% for ChatGPT and 12.5% for AI Mode. Gemini’s 63.8% local health share needs particular caution because it is based on only 47 recorded associations.
| Topic | ChatGPT Local / non-local |
AI Mode Local / non-local |
Gemini Local / non-local |
|---|---|---|---|
| Personal Finance | 80.0% / 20.0% | 51.0% / 49.0% | 76.4% / 23.6% |
| Home & DIY | 60.8% / 39.2% | 40.3% / 59.7% | 67.2% / 32.8% |
| Automotive | 64.5% / 35.5% | 40.0% / 60.0% | 73.2% / 26.8% |
| Travel | 43.1% / 56.9% | 46.9% / 53.1% | 42.4% / 57.6% |
| Fashion & Clothing | 50.6% / 49.4% | 20.6% / 79.4% | 53.5% / 46.5% |
| Sport & Fitness | 33.7% / 66.3% | 12.7% / 87.3% | 50.9% / 49.1% |
| Health & Wellbeing | 16.1% / 83.9% | 24.2% / 75.8% | 63.8% / 36.2%* |
| Consumer Electronics | 30.0% / 70.0% | 18.3% / 81.7% | 41.6% / 58.4% |
| Beauty & Skincare | 18.5% / 81.5% | 12.5% / 87.5% | 60.0% / 40.0% |
| B2B Software / SaaS | 14.5% / 85.5% | 16.4% / 83.6% | 25.1% / 74.9% |
5. How much do the cited sources overlap with the US results?
How often do the UK, Spain and Brazil cite sources also found in the US exports? The comparison matches each platform with its own US results. Domain overlap means the same site appears; while page overlap shows the normalized URL matches:
- The leading platform changes in Brazil. ChatGPT has the highest same platform US domain overlap in the UK (60.6%) and Spain (51.2%). AI Mode leads in Brazil (59.3%). However, after excluding google.com and youtube.com, ChatGPT leads in all three markets.
- Page overlap is much lower than domain overlap. AI Mode’s normalized URL overlap is 5.7% in the UK, 2.0% in Spain and 1.7% in Brazil. ChatGPT and Gemini range from 9.1% to 35.7%.
- Non-local sources often appear in the US results too. Across platform / market combinations, 38–82% of non-local citation weight goes to domains also cited by the same platform in the USA.
| Market | Platform | US domain overlap | US overlap excluding Google/YouTube | Pooled US domain overlap | US same page overlap |
|---|---|---|---|---|---|
| UK | ChatGPT | 60.6% | 60.4% | 62.9% | 33.0% |
| UK | AI Mode | 52.9% | 22.9% | 65.3% | 5.7% |
| UK | Gemini | 49.9% | 49.2% | 56.4% | 35.7% |
| Spain | ChatGPT | 51.2% | 50.7% | 52.3% | 23.5% |
| Spain | AI Mode | 36.5% | 21.2% | 41.3% | 2.0% |
| Spain | Gemini | 32.0% | 30.8% | 35.9% | 17.4% |
| Brazil | ChatGPT | 45.7% | 45.2% | 46.2% | 23.2% |
| Brazil | AI Mode | 59.3%25.8% | 62.0% | 1.7% | |
| Brazil | Gemini | 20.1% | 19.4% | 24.2% | 9.1% |
6. How do Google, YouTube and institutional sources affect the comparison?
The next table shows the full local share, the share going to google.com and youtube.com, and the local share after removing those two domains. It also groups local citations in institutional sources and all other local sources.
- Excluding Google and YouTube changes the ranking: AI Mode’s local share rises to 43.0% in the UK, 28.1% in Spain and 50.2% in Brazil. It leads in the UK and Spain, while Gemini remains ahead in Brazil.
- Institutions contribute more to ChatGPT’s local share. They account for 31% of its local citation weight in the UK, 46% in Spain and 33% in Brazil. Examples include gov.uk, fca.org.uk, bde.es, cnmv.es, gov.br and bcb.gov.br.
- Most local citations on AI Mode and Gemini fall outside that institutional group. The remaining share ranges from 81% to 99%. It includes retailers, publishers, services and other organizations.
| Market | Platform | Local, all citations | Google/YouTube share | Local excluding Google/YouTube | Local institutional | Other local |
|---|---|---|---|---|---|---|
| UK | ChatGPT | 40.8% | 0.5% | 41.0% | 12.7% | 28.1% |
| UK | AI Mode | 26.3% | 38.9% | 43.0% | 4.9% | 21.4% |
| UK | Gemini | 26.4% | 1.3% | 26.7% | 2.1% | 24.3% |
| Spain | ChatGPT | 24.8% | 1.0% | 25.0% | 11.3% | 13.4% |
| Spain | AI Mode | 22.6%19.3% | 28.1% | 1.8% | 20.8% | |
| Spain | Gemini | 16.6% | 1.7% | 16.8% | 0.5% | 16.1% |
| Brazil | ChatGPT | 41.3% | 1.1% | 41.8% | 13.8% | 27.5% |
| Brazil | AI Mode | 27.5% | 45.1% | 50.2% | 1.8% | 25.8% |
| Brazil | Gemini | 51.7% | 0.8% | 52.1% | 0.7% | 51.0% |
Conclusion
These findings show why we need to assess AI citation sources by market, topic and platform.
Local domains account for 41.4% of citations in Brazil, 38.3% in the UK and 24.0% in Spain, but no platform consistently has the highest local share across all three countries. The patterns also change by topic, making country averages only a starting point.
They also challenge the idea that localization and local sources can be ignored when working to maximize international AI search visibility.
Local websites are part of the citation mix in all three markets, with a majority of citations in some topics. Assuming that the content and sources supporting your visibility in one country will be enough everywhere can leave relevant opportunities out.
For your international AI search strategy:
- Start by identifying the sources cited for your priority prompts in each market.
- Review the pages to understand what information they provide, who they serve and where your brand has gaps.
- Use those findings to prioritize locally relevant content and opportunities to build your presence on the third-party sites that matter to your audience.
Complementary AI search guides
- The AI Search Optimization Framework and Checklist
- A 3 Layer Framework to Measure AI Presence, Readiness and Business Impact
- Third-Party Citation Optimization Prioritization in an AI Search Era
- Content Prioritization in an AI Search Era
- How to Build a Representative AI Search Prompt Library for Better AI Visibility Measurement
- AI Traffic vs AI Citations: What Clicks and Cited Pages Show About the AI Search Journey
![The AI Search Optimization Framework & Checklist – With Worksheet [Updated Sep 2026]](https://www.aleydasolis.com/wp-content/themes/aleydasolis/imgs/flecha.svg)


