Get the 3 Layer AI Search Diagnostic & Measurement Matrix
Updated on June 19, 2026
The old organic search measurement model, built largely around rankings, clicks, and sessions, is becoming less sufficient on its own in an AI search environment. And the more I talk to SEOs, marketers, and leadership teams, the clearer it becomes that most of us are still trying to adapt the old model rather than expand it into something fit for AI search.
- Traditional search generally gave us a ranked list of links, more query-level positional visibility, a largely click-led journey, and a measurement model heavily centered on Google.
- AI search gives us something different: synthesized answers, outputs that can vary across sessions, influence that may happen without a click, and fragmented experiences across ChatGPT, Perplexity, Gemini, Claude, Microsoft Copilot, and Google Search features such as AI Overviews and AI Mode.
Here’s one of the most important changes: a brand can now be surfaced, recommended, and materially influence a purchase decision in AI search without necessarily generating a click.
A user asks ChatGPT “what’s the best PR opportunity tool for a small agency managing B2B SaaS clients?â€, reads the answer, learns about three options, forms a preference, and then searches the brand name directly on Google. Or types the URL. Or opens the app. A meaningful part of the decision process may have happened inside the AI platform, while the eventual conversion was often attributed elsewhere.
That aligns with concerns raised by respondents in SEOFOMO’s Organic Search Trends survey around AI attribution and trust, reflecting how difficult it is to assess AI influence when many journeys do not produce directly attributable clicks.
So we need a different model. One that doesn’t confuse measurable with meaningful, and doesn’t throw out commercial accountability just because attribution is harder.Â
Here’s a framework that doesn’t claim complete attribution, isn’t a substitute for CRM or product analytics, and doesn’t promise that AI visibility will always translate into measurable business impact. It’s a structured way to measure, diagnose, and prioritize in an environment where observability is partial, platform behavior differs, and influence often extends beyond directly attributable clicks.
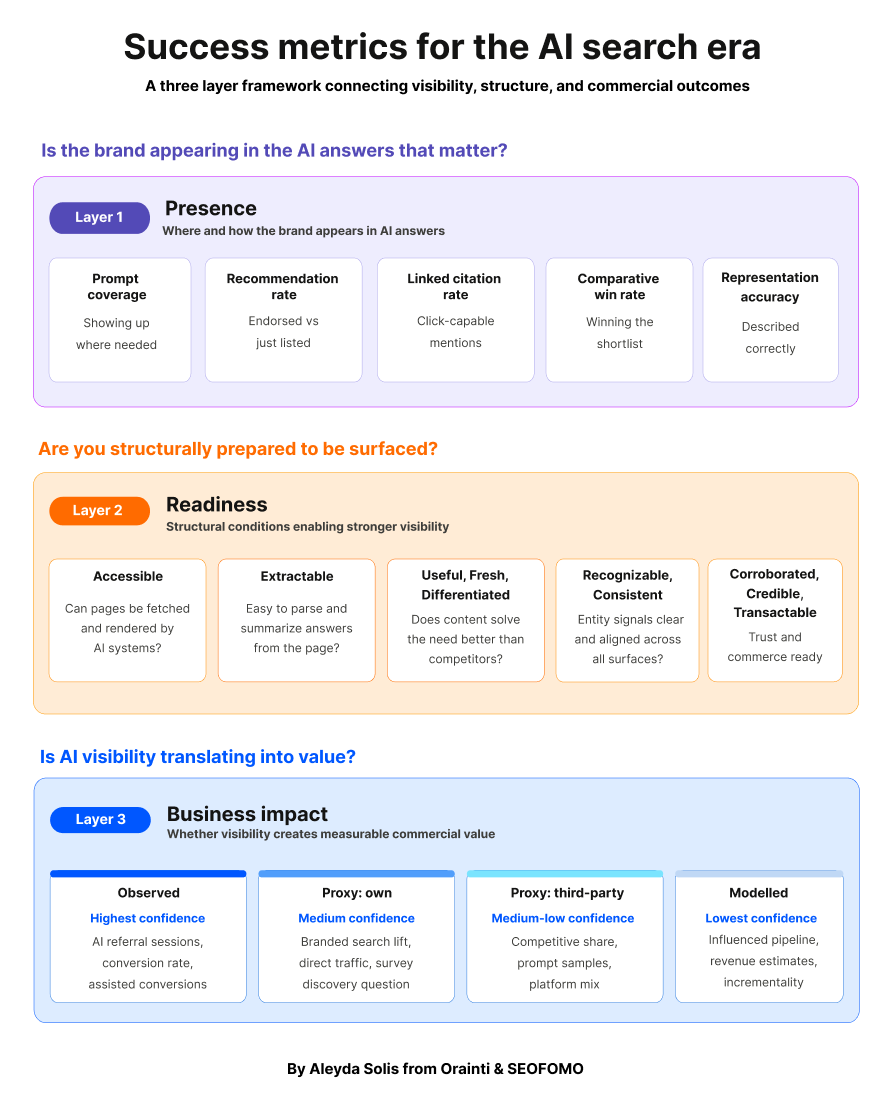
The 3 layers of AI search success
I’ve been working with this framework across client engagements and my own brands, and it has consistently helped produce more meaningful decisions than a single dashboard approach.
It has three connected metric layers:
| Metric layer | What it measures | Why it matters | KPI role |
|---|---|---|---|
| 1. Presence | Whether the brand appears in the AI answers that matter, how it’s represented, cited, linked, and recommended | Replaces traffic only thinking with visibility and representation measurement | Visibility KPIs: optimization and monitoring |
| 2. Readiness | Whether the structural conditions needed for stronger visibility are in place | Explains why visibility is weak, strong, or unstable, the diagnostic layer | Diagnostic KPIs: diagnosis and prioritization |
| 3. Business Impact | Whether visibility is translating into measurable value, using observed, proxy, and modelled signals | Connects AI search activity to commercial outcomes without overclaiming attribution | Outcome KPIs: executive reporting and decision-making |
The point isn’t to run three disconnected audits. It’s that:Â
- Presence tells you where the brand appears,
- Readiness tells you why it looks that way,
- and Business Impact tells you whether that visibility creates measurable value.
Each layer hands off a hypothesis to the next. That’s what turns three reports into one diagnostic.
A few principles before we go layer by layer:
- Readiness is not the same as visibility: Strong structure doesn’t guarantee being surfaced.
- Visibility is not the same as impact: Being mentioned doesn’t guarantee commercial value.
- Platforms and surfaces should usually be tracked separately: don’t blend Google AI Overviews and AI Mode, and don’t automatically blend ChatGPT, Perplexity, Gemini, Claude, or Copilot either. The interfaces, source behavior, link treatment, and measurement visibility differ enough that blending can hide useful signal.
- Not all prompts matter equally: Commercial, comparative, and shortlist prompts will tend to carry more weight than generic educational queries.
- Not all metrics deserve the same confidence: Observed, proxy, and modelled signals should remain separate and labelled.
- Measurement should lead to action: If a metric can’t change a decision, it shouldn’t be on the dashboard.
Let’s go through each layer.
Layer 1. Presence: Is the brand actually appearing, and how?
Presence answers the most immediate question: is the brand actually appearing in the AI answers that matter, and how is it being represented when it does?
Without this layer, teams run broad audits and ship generic optimizations without knowing what’s actually suppressing visibility. Presence is where the weakness becomes visible, by platform, prompt group, persona, product line, market, or source ecosystem.
How to set up your AI presence measuring protocol
Start narrow and deliberate. The goal is a measuring protocol focused on commercial value and action, not a giant prompt library that is not representative and meaningful:
- Prioritize the top 2 – 3 AI platforms based on a mix of measurable AI referral traffic in your vertical, audience usage, and commercial relevance. Besides taking into account your own site’s observable AI traffic, you can use tools like Similarweb, Semrush, and similar platforms to estimate which AI platforms appear to be driving more traffic in your sector and competitor set.
- Create prompt libraries that reflect the constraints real buyers actually use in AI platforms, not traditional search keywords stretched into prompts.
- Prioritize analysis around high commercial intent and high influence prompt groups. Discovery prompts matter, but shortlist and selection prompts are where deals are won or lost.
- Look for patterns over time, not single-run results, because AI outputs vary by session and platform. A single run is an anecdote; a sample is a signal.
- Translate each visibility gap into a likely readiness diagnosis:Â so Layer 1 hands off directly to Layer 2 rather than producing a scorecard that just sits there.
Build prompt libraries that reflect real buyer behavior
The most common prompt library mistakes I see look like this:
- Treating prompts like keywords without context.
- Only tracking “best X†prompts.
- Tracking too few prompts to get a stable read.
- Not tracking each market, language, product line, stage of customer journey and persona individually.
A poorly representative prompt library distorts what you measure and produces work that doesn’t drive value. A good one reflects how buyers actually discover, compare, validate, and choose, not what a keyword tool surfaces.
Where to source prompts from:
- Non-brand demand data.
- Sales call transcripts and support conversations.
- Reviews and community language (Reddit, Slack groups, industry forums).
- AI research tools’ sample data (Profound, Semrush).
- Similarweb prompt and AI traffic samples for your site and competitors, where available.
- Bing Webmaster Tools AI Performance report data, including citations, cited pages, and sampled grounding queries across supported Microsoft AI experiences.
- Your top ranked underperforming long-tail queries from Google Search Console.
Then group them by target market/language, product or service line, customer journey stage, audience/persona, and buyer constraint, and add realistic persona, product-line, market, and constraint variants.
Use constraints real buyers actually use in your prompts
This is the part most prompt libraries miss. For example, real AI prompts in B2B and consumer categories carry specific buyer constraints and if your prompt set doesn’t, you’re measuring a version of the market that doesn’t exist.
| Constraint dimension | Examples |
|---|---|
| Price band | free, under $X, enterprise |
| Team or company size | freelancer, small team, mid-market, enterprise |
| Industry or vertical | B2B SaaS, ecommerce, healthcare, financial services |
| Integration needs | tools the buyer already uses (Slack, HubSpot, Salesforce, etc.) |
| Geography and market | country, region, language |
| Use case or job-to-be-done | the specific problem being solved |
| Compliance or trust requirements | SOC 2, GDPR, HIPAA, industry certifications |
Now apply those constraints across each product line, persona, and journey stage. Here’s how it looks for Finchling:
| Stage | Persona | Key constraints | Example prompt |
|---|---|---|---|
| Top of funnel | PR agencies | Team size, client count, industry focus, integration needs, price band | “What are the best PR opportunity tools for a 10-person digital PR agency managing 15 B2B tech clients that needs Slack integration?†|
| Top of funnel | In-house PR teams | Company size, industry, geography, integration, compliance | “Which tools help an in-house PR team at a healthcare company find timely media opportunities while supporting stricter compliance needs?†|
| Mid funnel | PR agencies | Team size, vertical, integration, budget, workflow | “Finchling vs Google Alerts for a small PR agency managing multiple B2B SaaS clients: which is better for finding relevant opportunities faster?†|
| Mid funnel | In-house PR teams | Industry, company size, geography, workflow, trust | “What is the best PR tool for an in-house communications team that needs trustworthy, relevant story opportunities for a mid-market SaaS brand in Europe?†|
| etc … | … | … | … |
Top of funnel prompts are category discovery and broad solution prompts. Mid funnel prompts are comparative, evaluation, use-case, and trust prompts. Both tracked separately.
Apply prompt pragmatic sampling, not exhaustive coverage
Once you add constraints across personas, product lines, and customer journey stages, the prompt set expands fast. Don’t try to cover everything, prioritize highest value combinations and document what you’re not tracking so gaps are explicit.
| Brand profile | Rough library size |
|---|---|
| Single product, loose persona segmentation | 30–60 prompts across key journey stages with a small set of high-priority constraints |
| Single product, strong persona segmentation | 50–100 prompts across personas, journey stages, and selected buyer constraints |
| Multi-product or multi-service brand | 100–250+ prompts segmented by line, persona, stage, and prioritized constraints |
| Enterprise or holdco with multiple verticals | 250+ prompts across multiple lines, personas, markets, stages, and constraints |
It’s important to group prompts by topics to track and assess your visibility share at a topical level, not at the individual prompt level. AI outputs are dynamic. Topic-level aggregation is what gives you a reliable trendline.
The 5 Presence KPIs you need
Once your prompt set is ready, measure your AI presence using these five core Presence KPIs.
They’re the minimum because each one answers a different key question to understand your brand AI search presence. You can calculate some of them directly in prompt tracking tools, but others require a custom scoring framework or defined manual review protocol.Â
| KPI | Question it answers | How to calculate |
|---|---|---|
| 1. Prompt coverage | Are we showing up where we need to? | (Tracked prompts where the brand appears ÷ Total tracked prompts) × 100 |
| 2. Recommendation rate | Are we being endorsed, or just included? | (Appearances where the AI explicitly recommends the brand ÷ Prompts where the brand appears) × 100 |
| 3. Linked citation rate | On platforms and prompt types where links are surfaced, is the visibility capable of driving visits or purchases? | (Appearances with a clickable link to the brand ÷ Prompts where the brand appears) × 100 |
| 4. Comparative win rate | Are we winning the shortlist when users compare options? | (Comparison prompts where the brand is the preferred option ÷ Comparison prompts where the brand appears against competitors) × 100 |
| 5. Representation accuracy | Are we being understood properly, or misrepresented? | (Appearances with factually correct positioning ÷ Prompts where the brand appears) × 100 |
Method note: not every KPI in this framework is equally objective. Some are directly measurable from platform or analytics data; others require a documented scoring protocol, repeated sampling, and human review. Treat recommendation rate, comparative win rate, and representation accuracy as structured decision support metrics rather than platform native ground truth. Report them separately and label confidence clearly.Â
For any scored KPI, document the rubric, sample size, review cadence, and whether the outputs were assessed by one reviewer or calibrated across multiple reviewers.
Here’s an example of how they work:
- Prompt coverage: If you track 100 relevant prompts and the brand appears in 42, prompt coverage = 42%.
- Recommendation rate: Out of 40 prompts where the brand appears, the AI explicitly recommends it in 18, recommendation rate = 45%.
- Linked citation rate: The brand appears in 30 answers, and in 12 the AI includes a clickable link to the site, linked citation rate = 40%.
- Comparative win rate: Across 20 comparison prompts like “What’s better for digital PR teams, Finchling or Google Alerts?â€, the AI favors Finchling in 11 responses, comparative win rate = 55%.
- Representation accuracy: The AI mentions Finchling in 25 answers with 20 of them being accurate (platform for reactive and proactive PR opportunities), 5 incorrect (generic media monitoring tool), representation accuracy = 80%.
Measured on their own, each number is interesting. Read together, they’re a diagnosis.
Which presence KPIs should lead your dashboard? It depends on your business model
Not every business should lead with the same metric. The same visibility gap has a different commercial meaning for a publisher than for a SaaS platform than for an ecommerce brand.
- Transactional sites (ecommerce, marketplaces, bookings): Often lead with linked citation rate and comparative win rate, especially on platforms and prompt types where links are surfaced clearly enough to support click-out behavior. Revenue depends on click-capable mentions and winning selection-stage prompts like “best running shoes under $150†or “cheapest flights to Lisbonâ€.
- Lead gen and service sites (agencies, local services, consultancies): Lead with recommendation rate and comparative win rate. The buyer journey is consultative: being actively endorsed for provider-selection prompts like “best PR agencies for SaaS†is the signal that matters.
- SaaS and product-led businesses: Lead with recommendation rate, comparative win rate, and representation accuracy. Crowded, comparison-heavy categories where being framed correctly is as important as being surfaced.
- Publications and media sites: Lead with linked citation rate and prompt coverage. The business model depends on referral traffic and being treated as an authoritative source.
- Informational, educational, or nonprofit sites: Lead with prompt coverage and representation accuracy. Success is being reliably surfaced for the right topics with the right information.
If you’re unsure which KPI should lead, ask yourself these questions:
- Does revenue require a click, or can value be created by the AI mention alone?
- Is the category comparison heavy, or discovery heavy?
- Are commercial and selection stage prompts where the money is, or do informational and discovery prompts drive most of the pipeline?
- Is the brand sold directly on-site, through partners, through marketplaces, or offline; and therefore how much does linked citation rate actually matter?
- Is being described correctly commercially critical, or is any mention a net positive?
- Which metric, if it moved by 20% next quarter, would most plausibly change the business outcome: sessions, pipeline, revenue, recall, or authority?
That last question is the one that matters most.
The metric that answers “yes, moving this would change the business outcome†is the one that belongs at the top of your dashboard. Everything else is secondary.
Build the AI search presence dashboard and use it to answer real questions
You can build your own Presence dashboard using AI monitoring platforms such as Similarweb, Profound, Peec AI, Semrush, Sistrix, Waikay, or your own internal tracking setup. Choose based on which platforms, prompts, exports, citation data, and scoring workflows they actually support, since tool coverage and methodology differ.
What matters isn’t the tool. What matters is whether the dashboard answers these questions:
- Where does the brand appear, and where is it silent? Which platforms, journey stages, personas, product lines, or markets show the widest gaps?
- When the brand appears, is it genuinely recommended or merely listed among alternatives?
- Are mentions click-capable, or do they stay trapped inside the AI answer with no link?
- In head-to-head or shortlist prompts, does the brand win, tie, or lose — and against whom consistently?
- Is the brand being described accurately, or is it misframed, outdated, or confused with another product?
- Which third-party domains shape the outcomes, and where is the source ecosystem working against the brand?
And each presence KPI should map to a specific action:
| KPI | How to report | What to learn / action |
|---|---|---|
| 1. Prompt coverage | Monthly, segmented by platform, stage, persona, product line, market | Low values point to visibility or distribution gaps |
| 2. Recommendation rate | Monthly with competitor benchmark | Low values point to trust, corroboration, or differentiation gaps |
| 3. Linked citation rate | Monthly by platform and prompt group | Low values point to extractability or page structure gaps |
| 4. Comparative win rate | Monthly vs. 3 to 5 key competitors | Low values point to positioning or proof gaps |
| 5. Representation accuracy | Monthly, with examples of misrepresentation | Low values point to entity clarity or consistency issues |
That last column is the handoff to Layer 2.
AI search presence stops being a report the moment each weak metric maps to a structural hypothesis to test.
Layer 2. Readiness: Are you structurally prepared to be surfaced?
Readiness explains the structural reasons behind the visibility patterns surfaced in Layer 1 and identifies which issues are most likely limiting stronger AI search performance.
Without this layer, teams respond to visibility gaps with generic content or technical work that doesn’t address the real bottleneck. Readiness turns Presence findings into structural priorities that can actually move the needle.
Start from Presence findings, not from a blank audit
The first rule of Readiness assessment: don’t run a blanket audit. Start from the specific patterns Layer 1 surfaced.
- Mentions without links often point to Accessible, Extractable, or Fresh gaps.
- Weak category visibility often points to Corroborated, Differentiated, or Useful gaps.
- Weak recommendation rate often points to Credible, Corroborated, or Differentiated gaps.
- Poor representation accuracy often points to Recognizable or Consistent gaps.
- Weak commercial visibility often points to Transactable, Extractable, or Useful gaps.
This is why Layer 1 hands off to Layer 2: You’re not auditing everything, you’re testing the structural hypotheses Presence surfaced.
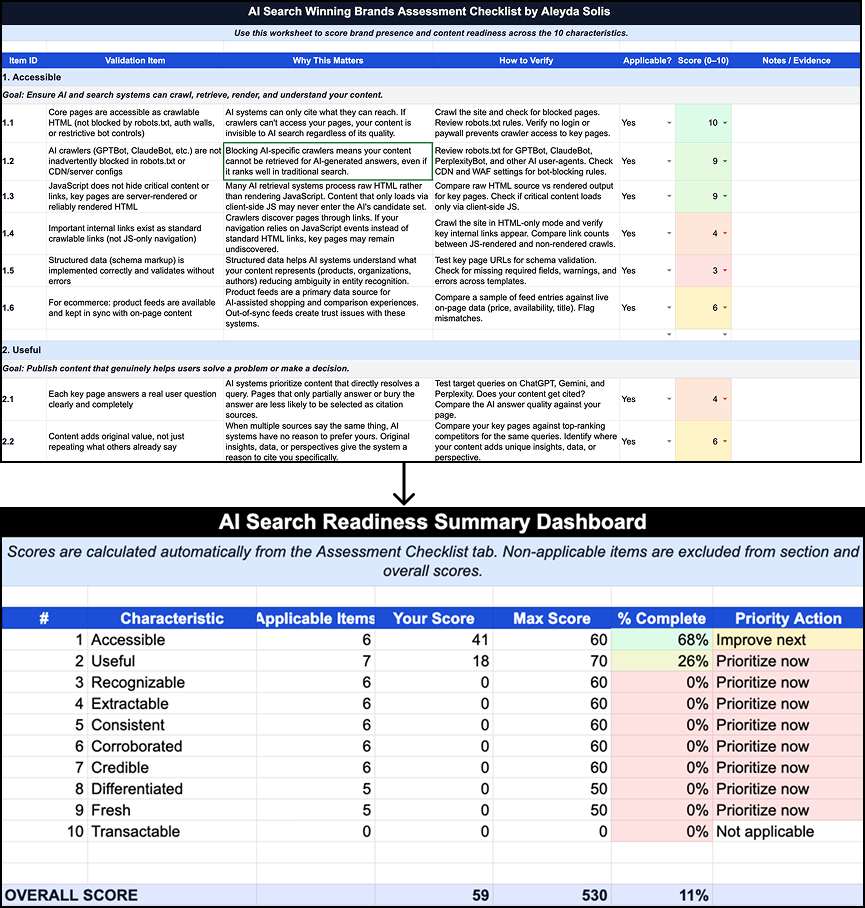
The 10 characteristics of AI search winning brands
The ten characteristics I’ve identified for AI search winning brands in this guide are your Readiness dimensions. They can be scored and tracked over time as diagnostic measures.
| Characteristic | Core question to assess |
|---|---|
| Accessible | Can the relevant pages be reached, rendered, indexed, and fetched reliably by the systems that make them eligible to appear in search and AI mediated search experiences? |
| Extractable | Are key answers, positioning, and differentiators easy to parse and summarize from the page? |
| Useful | Does the content solve the user need competitively — better than what else is on the first page of AI answers? |
| Fresh | Is the content recent enough (publish/update dates, current facts, live pricing) to remain credible and citable? |
| Differentiated | Is the positioning clear, specific, and ownable — or is the language interchangeable with competitors? |
| Recognizable | Are brand and entity signals explicit (name, category, founder, HQ, funding, product lines) and machine-readable? |
| Consistent | Do those entity signals match across site, Wikipedia/Wikidata, LinkedIn, review sites, and press? |
| Corroborated | Do multiple independent third-party sources reinforce the same positioning and claims? |
| Credible | Do the sources that reinforce the brand carry weight (recognized publications, analyst coverage, peer-reviewed or primary data)? |
| Transactable | Are pricing, plan logic, feature comparisons, and evaluation surfaces clear enough that AI systems can answer “which plan fits my case†questions? |
I’ve published a fuller AI Search Readiness Checklist covering each characteristic, why it matters, how to verify it, and which tools can help assess it. You can use that as your audit reference rather than reinventing one.
Tie the AI search readiness audit to the visibility gap
The AI search readiness audit becomes useful when you focus it on the characteristics most likely to explain your Presence pattern. For reporting, group the ten characteristics into five themes, as they share root causes and tend to move together.
| Theme | When to prioritize | How to report | What to learn / action |
|---|---|---|---|
| Accessible | Content appears hard to fetch or pages are missing from cited outcomes | Quarterly, with evidence and owner | Crawl, fetch, rendering, or access barriers suppressing visibility |
| Extractable | Brand is mentioned but rarely linked or summarized cleanly | Quarterly, tied to key landing pages | Content hard for AI systems to parse, summarize, or cite |
| Useful / Fresh / Differentiated | Category visibility or recommendation is weak | Quarterly by priority segment | Content doesn’t solve the question well enough, is stale, or lacks clear positioning |
| Recognizable / Consistent | Brand is misdescribed or inconsistently framed | Quarterly with examples | Entity clarity and message consistency problems across surfaces |
| Corroborated / Credible / Transactable | Trust, shortlist, and commercial prompts are weak | Quarterly, linked to source ecosystem and commercial pages | Often explain weak recommendation, weak comparison, and weak commercial visibility |
Use your Presence data to focus the analysis on the sites that are actually influencing your visibility. Tools like Profound, Similarweb and Semrush surface which third-party domains AI systems cite for your prompts. That’s where your corroboration work should go, not a generic “get more mentions†program.
An AI search readiness assessment outcome example
Say your Presence dashboard shows the brand appears in 70% of “best PM tools for engineering†prompts but in only 12% of “[brand] vs competitors†head-to-head prompts, and in that 12% it’s framed as “a newer alternative†rather than on its actual differentiators.
That’s not a distribution problem since visibility exists upstream. It’s a Differentiated + Corroborated + Credible gap.
The brand is surfaceable but not positioned strongly enough in the third-party sources AI platforms weigh at the comparison stage. So Layer 2 work should focus on comparison-site pages, analyst coverage, and positioning consistency across G2/Capterra/review sites.
Prioritize with effort, not just impact
Once you record the assessment outcome score, evidence, affected segment, owner, effort, and likely effect on Stage 1 KPIs for each gap, you can then prioritize using:
Likely impact on key visibility gap × commercial importance ÷ ease of implementation
The effort denominator is what makes the roadmap realistic:Â
- An outdated pricing page causing Transactable failures on “cheapest PM tool†prompts should ship this week.
- A weak analyst coverage program reducing Credible signal on shortlist prompts should get funded and planned over 6-12 months, but it doesn’t block short-term wins.
That’s how you end up with roadmaps that never ship.
Layer 3. Business Impact: Is AI visibility translating into value?
The goal of this layer is not perfect attribution. It’s an honest reporting model to support budget, planning, and prioritization decisions without over-claiming.
No current measurement stack delivers complete, clean AI search attribution across platforms, surfaces, and journeys.
Google and Microsoft now provide partial, but still incomplete, visibility into AI search behavior. Google documents that AI Overviews and AI Mode are included within Search Console’s overall Web Performance reporting rather than broken out as separate standalone reports. Microsoft now provides AI Performance reporting in Bing Webmaster Tools public preview with citation counts, cited pages, and sampled grounding queries.
What this layer delivers is a layered reading of observed data, directional proxies, and modelled estimates: kept separate, labelled by confidence, and reviewed on a cadence the business can act on.
If I could put one sentence in front of every CFO on this:
Measured AI referral traffic is the floor, not the ceiling, of AI’s contribution. In other words, observed AI-referred sessions are a measurable subset of AI influence, not a complete measure of it.
A large share of AI influenced conversions return through branded search or direct traffic after a user saw the brand in an AI answer and did not click. Reporting only observed AI referral sessions systematically understates impact.
That’s not an excuse, it’s a design constraint, and the three-layer confidence model below is how you report around it honestly.
Four Business Impact confidence layers that shouldn’t be blended
The single most common reporting failure in AI search measurement is collapsing direct evidence, directional proxies, and modelled estimates into one undifferentiated “AI impact†number. Once those layers blur together, a CFO asks one question about methodology and the whole construct falls apart.
Label every metric in your dashboard with its confidence layer:
| Business Impact Layer | What it is | Question it answers |
|---|---|---|
| Observed | Metrics from platforms passing a referrer or UTM. Highest confidence, lowest coverage. E.g. AI-referred sessions, AI conversion rate, revenue per AI visit, AI-assisted conversions. |
How many users clicked and converted from an AI answer? |
| Proxy: own | Directional signals from your own analytics. Medium confidence, broader coverage. E.g. branded search lift, direct/unattributed lift, demand for cited pages, survey-based discovery. |
Is there evidence users are seeing us in AI answers even when they don’t click? |
| Proxy: third-party | External data from tools that sample or model AI traffic across the web. Medium-to-low confidence, but the only window onto competitors and prompt-level behavior. E.g. Similarweb AI traffic behavior vs. competitors, prompt samples per page. |
How does our AI presence compare to competitors and which prompts are driving AI traffic? |
| Modelled | Estimates from applying assumptions to observed and proxy data. Lowest confidence. E.g. influenced pipeline, influenced revenue. |
If we assume X% of branded search lift is AI attributable, what is the implied pipeline? |
Each layer answers a different question. Treating them as one number makes all four less useful, not more.
What this looks like in practice: a Finchling monthly report:
- Observed: 1,820 AI-referred sessions, 6.1% trial start rate, 2.4x the organic benchmark.
- Proxy – own: Branded “Finchling†search +22% QoQ; direct traffic to /features/reactive-pr +38% QoQ.
- Proxy – third party: Similarweb estimates roughly 4,200 AI sessions for the period, versus 1,820 observed in GA4; within the PR tools peer set, estimated AI traffic share is 6% for Finchling versus 41% for Muck Rack and 22% for Prowly.
- Modelled: Based on estimated incremental branded demand above baseline for the quarter, a 30% AI influence assumption, and historical branded search to pipeline conversion rates, estimated influenced pipeline ~€14K ARR. Caveat band attached.
It’s important to note how each line is reported separately with its confidence label, and never collapsed into a single “AI impact†figure.
Build the business impact observed layer
The observed layer starts in your web analytics stack and, where possible, extends through to CRM or downstream revenue reporting. The setup itself is manageable, but it is not enabled by default, and it loses usefulness quickly if nobody maintains the tracking rules, channel definitions, and reporting logic over time.
If you’re setting this up in GA4, Dana DiTomaso’s guides on How to Track and Report on Traffic from AI Tools and AI Traffic Analysis: Building GA4 Audiences That Drive Decisions are strong practical references to start.
In GA4, the cleanest approach is to create a dedicated custom channel group for AI traffic.
Go to Admin → Data display → Channel groups → Create new, duplicate your existing grouping, and add a channel such as AI Search or AI Assistants using a Source matches regex rule. Google explicitly documents using a GA4 custom channel group with regex-based rules to group AI assistant traffic for reporting.
The channel order matters. GA4 includes traffic in the first channel whose definition it matches, so an AI assistants channel should sit above Referral and any broader matching rules. If Referral appears first, eligible AI traffic may be classified there before your custom AI rule ever fires.
For the regex, use a maintained starter pattern, not a fixed “final†list. Google’s documentation provides an example regex for AI assistants, but your version should be updated over time based on the actual referrers and URL patterns your property receives.
A practical version can include platforms such as ChatGPT, Perplexity, Claude, Gemini, Copilot, DeepSeek, Grok, You.com, Phind, and Mistral, but the exact coverage will depend on the referrers and URL patterns your own property is actually receiving. Google’s example uses broader pattern matching rather than relying only on a narrow set of exact hosts.
What this layer captures well:
- Traffic from AI platforms that pass a usable referrer or source parameter can be measured directly in GA4 via the custom channel group.
- Some AI platforms are more observable than others in GA4 because referrer behavior varies by product, browser, app handoff, and click path. Treat platform-level observability as variable, not guaranteed.
What this layer doesn’t capture cleanly:
- Some AI driven visits will still collapse into Direct, Referral, or other channels because of app handoffs, copied URLs, privacy controls, or missing referrer data. So the observed layer is useful, but incomplete by definition.
- Google AI Overviews and AI Mode are not cleanly exposed in GA4 as their own native standalone traffic source. Google documents that AI Overviews and AI Mode are included in Search Console’s overall search results performance reporting, but that still does not make them cleanly separable as a distinct traffic source in GA4.
What to track in the observed layer:
- AI Sessions by platform, landing page, device.
- Engagement rate and average engagement time versus the organic benchmark. Google has said that clicks from search results pages with AI features can be higher quality, for example by users spending more time on site, but that should be validated against your own benchmarks rather than assumed across all platforms or experiences. If it consistently underperforms your benchmark, that can indicate a landing page mismatch, weak prompt fit, or lower-quality visibility than expected.
- AI conversion rate and revenue per visit, segmented by platform where volume allows.
- AI assisted conversions (data-driven attribution in GA4, or multi-touch in the CRM).
- Top AI landing pages: The pages that are actually being cited. This list is likely the most useful insight for informing Layer 2 work.
Add business impact proxy signals and interpret them together
The observed layer is the floor. Proxy signals fill in some of the ceiling.
None of these metrics prove AI influence on their own. The value comes from reading them as a set and asking whether the pattern is consistent with an AI driven story:Â
- Own-site proxies have higher trust but are inward-looking.
- Third-party tools signals have lower trust but are the only window onto competitors and prompt-level behavior.
You need both.
Own site proxy signals to track
Here’s a list of key “Own proxy” business impact signals to track:
| Signal | How to capture |
|---|---|
| Branded search trend | GSC query report filtered to brand terms, or the native branded/non-branded toggle. Track WoW and MoM. |
| Direct and unattributed traffic trend | GA4 Direct and other unattributed traffic, especially to pages not actively being pushed through email, paid, or other known campaigns. Treat this as a weak corroborative proxy only, since GA4 direct means traffic without a clear referral source. |
| Demand for frequently-surfaced pages | Impressions and direct/organic traffic to pages you’ve verified are cited in AI answers. |
| Survey based discovery | One question added to signup, demo, or post-purchase flows. |
| Bing Webmaster Tools AI Performance | First-party citation counts, cited URLs, and grounding queries for Copilot and Bing AI. Currently the clearest first-party citation reporting publicly available from a major AI search ecosystem. |
| Social listening on brand mentions | Reddit, LinkedIn, Slack communities where “has anyone used X?†conversations happen. |
An important, easy to set survey based discovery proxy signal
There’s one survey question that earns its place and I recommend to add to your signup flow, demo request, or post-trial onboarding:
“Before signing up, did you come across [brand] in an AI assistant or AI search experience, such as ChatGPT, Perplexity, Claude, Gemini, Copilot, or Google’s AI features?â€
Options: Yes / No / Not sure.
Place it after the core signup fields, not before. Optional. One question, no follow-up (the moment it becomes a mini-survey, completion rates collapse and you want to avoid that).Â
Why it matters disproportionately: a rising “Yes†rate among users attributed to Direct or Branded Organic is one of the strongest first-party proxies that AI influence exists beyond what analytics can directly observe.
- Users who arrive via branded search with a high “Yes†rate are the invisible AI influence. They’re attributed to Organic in GA4 but wouldn’t have searched the brand without an AI mention.
- Users who arrive via Direct with a high “Yes†rate are the mobile-ChatGPT copy-paste cohort. GA4 attribution is entirely blind to them.
- Users who arrive via the AI Search channel itself but answer “No†may include misattributed traffic: agency traffic, internal team members, secondary clicks.
Third-party proxy reads worth running monthly
Similarweb, Semrush and equivalent tools can fill gaps your own analytics can’t cover directly, although imperfectly. Data comes from panels, clickstream samples, and modelling, not from your logs. Use them for relative reads (us vs. competitors, this month vs. last, prompt A vs. prompt B) rather than absolute claims.
Here are 3 specific reads to run monthly:
1. Prompt samples driving traffic to your top AI landing pages.
Similarweb surfaces a sample of the prompts that produced AI referred visits to specific URLs. Use it to extend your Presence prompt set, diagnose landing page mismatch, and inform Readiness work.Â
2. Competitive benchmarking of AI traffic share, top landing pages, and top prompts per page.
Track your estimated share of AI-referred sessions across a defined peer set over time. A rising share is usually a positive signal; a flat share during category growth may indicate relative loss. Identify which pages every competitor is getting AI traffic to (commodity pages) and which are distinctively yours (your moat).
3. AI platform mix over time, benchmarked.
Spot platform specific decay (your ChatGPT share flat while a competitor’s doubles), platform specific wins (your Perplexity share disproportionately high, reverse-engineer what earned it), and category shifts (the whole competitor set losing ChatGPT share while AI Mode rises).
Reading the proxies together: three common patterns
Proxies only become useful when interpreted as a pattern. Here are 3 readings that come up often:
Scenario A: Hidden success.
AI referral sessions flat. Branded search +18%. Direct +9%. Survey “how did you hear about us†shows rising AI mentions. Third-party AI traffic share growing relative to peers.
- Reading: visibility is working; users see the brand in AI answers but arrive via brand name or direct. Impact is real but hidden. Most common pattern for established brands.
- Move: keep investing, and lean on survey data, branded search evidence, and competitive share in reporting rather than observed sessions alone.
Scenario B: Traffic without fit.
AI referral sessions up. Branded search flat. Conversion rate from AI below organic benchmark. Third-party prompt samples show prompts driving traffic to pages not built for those prompts.
- Reading: traffic is arriving but not qualified. Likely recommendation quality or landing page mismatch.
- Move: audit the sampled prompts against their landing pages, and either redirect cited URLs to more specific pages or rewrite pages to match intent. Most fixable of the three and often the fastest QoQ improvement.
Scenario C: Clean case.
AI referral sessions up. Branded search up. AI-assisted conversions visible. Survey signal rising. Third-party share up, platform mix diversifying.
- Reading: observed, own-proxy, and third-party signals all point in the same direction. This is consistent with share gain rather than simply benefiting from category growth.
- Move: scale investment, expand prompt coverage to adjacent clusters, and keep testing the estimate against future survey, branded-demand, and observed conversion trends.
Build the business impact modelled layer
The observed layer measures what you can see. The proxy layer signals what you can infer. The modelled layer estimates what you can’t measure directly but may still need a planning number for, typically when leadership asks “what is AI search actually worth to us?†and observed sessions alone understate the answer.
Modelled metrics aren’t a replacement for observed and proxy data. They’re a principled way of combining them into a planning number. The rigor comes from making the assumptions explicit, keeping the confidence band wide, and never presenting the output as proof.
The baseline modelled estimate
The simplest version applies an assumption to a proxy signal:
(Incremental branded clicks, visits, leads, or pipeline above baseline) × (stated AI influence assumption %) = modelled influenced value
For example, applied to Finchling: first estimate the incremental branded demand above baseline for the quarter, then apply a 30% AI influence assumption to that increment, then translate that influenced share into ARR using historical branded-search-to-pipeline or branded-search-to-ARR rates. That yields the modelled influenced pipeline range.
Inputs to combine:
- Branded search lift from GSC:Â the clearest proxy most brands will have.
- Direct traffic lift to cited pages: useful where mobile to direct AI journeys are common.
- Survey AI discovery rate: often the strongest first-party anchor for the AI influence assumption, because it grounds the estimate in observed user reported behavior.
- Historical conversion value per visit or lead:Â to translate sessions into commercial terms.
How to choose and justify the attribution assumption:
- Start from the survey “Yes†rate among users arriving via branded search or direct. If roughly 30% of relevant new signups report seeing the brand in an AI assistant, that can be used as a reasonable starting assumption, provided the sample size, response rate, and wording are stable enough to compare over time.
- Cross-check against third-party AI traffic share. If branded search, survey-based AI discovery, and external AI traffic indicators rise together, confidence in the assumption increases. If they diverge, confidence decreases and the estimate should be discounted.
- Document what you excluded. Product launches, paid campaigns, or PR moments in the same window should come off the top.
How to report it:
- Always as a range, never a single number.
- Always with the stated attribution assumption, inputs, exclusions, and timeframe clearly documented.
- Always below the observed and proxy numbers in the dashboard, not above them.
A reportable line looks like:
“Modelled influenced pipeline for Q1: €12–16K ARR, based on an estimated increment in branded demand above baseline for the quarter, a 30% AI-influence assumption applied to that increment, and historical branded-search-to-pipeline conversion rates, cross-checked against rising survey discovery rate (27% → 34%) and stable third-party AI share.â€
What the modelled layer captures well
- A planning number that accounts for AI influence invisible to observed tracking.
- A way to translate directional proxy signals into commercial terms leadership can use for budget conversations.
- A disciplined alternative to either ignoring AI influence because it can’t be measured cleanly, or overclaiming it by crediting AI for every branded search lift.
What the modelled layer doesn’t capture cleanly
- A modelled estimate should be treated as a planning construct, not as attributed revenue.
- Platform-specific attribution. The assumption applies across AI search as a whole.
- Short-term movements. Modelled estimates stabilize over quarters, not weeks.
What to track
- Modelled influenced pipeline or revenue, stated as a range with inputs documented.
- Attribution percentage applied over time, tracked alongside survey discovery rate so the two move together.
- Sensitivity band: What the number looks like at ±10 percentage points of attribution %, so leadership sees how much depends on the assumption.
Refresh quarterly, not monthly: The inputs are too noisy below that cadence. Re-validate the attribution percentage every two quarters against the survey response rate, and retire the estimate entirely if the inputs become unreliable. A modelled number built on a broken input is worse than no number at all.
Something to remind: this is for planning, never for proof.
The moment it gets cited as a defensible attribution figure rather than a working assumption, it stops being useful and starts eroding trust in the whole dashboard.
The Business Impact metrics summary
Here’s a summary of the observed, own proxy, third party proxy and modelled business impact metrics shared in the guide, and what they tell you:
| Business Impact Metric | Confidence layer | What it tells you |
|---|---|---|
| AI-referred sessions | Observed | Whether known AI traffic is growing or shrinking. The floor, not the ceiling. |
| AI conversion rate / revenue per visit | Observed | Quality signal vs. organic benchmark. Under-benchmark = landing-page or prompt-match issue. |
| AI-assisted conversions | Observed | Whether AI contributes to conversion paths even when not the final click. |
| Branded search / direct / surfaced-page demand | Own proxy | Detects recall and downstream demand effects beyond measurable referrals. |
| Survey AI discovery rate | Own proxy | Surfaces AI influence on users who arrive via branded or direct — otherwise invisible. |
| BWT AI Performance citations and grounding queries | Own proxy | Useful first-party signal for understanding citation readiness and AI source visibility across Microsoft supported AI experiences. |
| Third-party AI traffic share vs. peers | Third-party proxy | Shows whether observed growth is share-taking or category-riding. Flat share during category growth means loss. |
| Third-party prompt samples per top landing page | Third-party proxy | What question triggered the traffic. Drives prompt-set updates and page fixes. |
| Third-party AI platform mix vs. peer average | Third-party proxy | Platform-specific risks and opportunities. Over-indexing on one platform is a fragility signal. |
| Modelled influenced pipeline / revenue | Modelled | A planning estimate, not attributed proof. Overclaiming here erodes trust in the whole dashboard. |
Tying the three AI search Presence, Readiness and Business Impact metric layers together: where this becomes strategic
This is the part that matters most: a connected diagnosis is what drives action. The matrix below shows how the three AI search metric layers can be read together as a single diagnostic:
| Pattern | What it usually means | Likely next move |
|---|---|---|
| Low readiness + low visibility | Structural conditions are holding the brand back. Most common early-stage pattern. | Prioritize access, extractability, entity clarity, corroboration. |
| High readiness + low visibility | Brand is underdistributed or underrepresented in the source ecosystem. Common for mature brands in crowded categories. | Focus on source presence, distribution, trust ecosystem, competitive disadvantage. |
| Visibility improving + impact flat | Brand is appearing but not memorably, persuasively, or on the right pages. The commercially dangerous middle state. | Improve recommendation quality, linked citations, memorability, landing page fit. |
| Strong informational + weak commercial visibility | Visible early in the journey but not winning shortlist or selection moments. Classic SaaS pattern at scale. | Improve commercial prompt coverage and transaction-ready surfaces. |
| High visibility + strong recommendation + weak representation accuracy | Being talked about but described wrong. Often the most commercially damaging pattern — actively costs deals. | Entity and source correction: Wikipedia / Wikidata, schema consistency, review sites, analyst briefings. |
| One segment strong, another weak | Issue is segment-specific, not brand-wide. Easy to miss in aggregate dashboards. | Run a segment-specific readiness and source-ecosystem review. |
An example with Finchling insights
- Base reading:
- Presence dashboard shows 58% prompt coverage in ChatGPT for discovery prompts but 11% recommendation rate in shortlist prompts.
- Readiness shows Differentiated and Credible scoring well, but Corroborated scoring low (few third-party reviews, limited presence on roundup sites).
- Business Impact shows flat AI referral traffic and slightly rising branded search.
- Matrix read: “high readiness + low visibility†at the commercial end of the funnel.
- Diagnosis: much of the structural work appears to be in place. The bottleneck is source ecosystem presence at the comparison stage. AI models have nowhere to learn about Finchling in the context of selection prompts because Finchling is not in the sources they cite for those prompts.
- Move: There should be a concentrated effort on getting Finchling onto software roundup pages, G2 and Capterra category pages, and reactive PR tool comparisons. Not more content. Not more technical optimization. The lever in this case is external corroboration.
That’s what tying the layers together gives you: targeted recommendations and actions to close the existing AI search gaps that will drive business impact.
Where to start: the 3 layer framework minimum viable setup
The framework scales to a full enterprise program, but a lean version can often be made operational in about two weeks.
Week 1: Baseline.
- Define priority platforms, competitors, personas, product lines, markets.
- Build 50-70 priority prompts across Discovery, Evaluation, Selection, Post-purchase.
- Run the first visibility baseline (5–7 runs per prompt per platform).
- Identify top cited domains and biggest source-ecosystem gaps.
- Define Layer 1 KPI set and dashboard shell.
Week 2: Connect the layers.
- Translate the three biggest Layer 1 gaps into Readiness hypotheses.
- Run a targeted readiness audit on those hypotheses only.
- Set up the GA4 AI referrer channel group.
- Add the one AI discovery question to signup, demo, or post-purchase flows.
- Define the weekly, monthly, quarterly review rhythm.
- Assign first actions and owners.
You should end week two with:
- A visibility baseline by platform and stage (one number per cell, sample size documented)
- A top 10 list of third-party domains shaping category answers
- Three Readiness hypotheses with owners and target dates
- A functioning AI channel group in GA4
- A live discovery question in at least one acquisition flow
- A scheduled monthly review with the right three or four people in the room.
The framework scales from here.
The takeaway
Redefining success metrics for the AI search era means measuring performance across three layers:
- Presence tells you whether and how the brand appears.
- Readiness tells you whether the structural conditions for stronger visibility are in place.
- Business Impact tells you whether that visibility is creating measurable value.
Measurement in AI search isn’t about more dashboards. It’s about connecting where the brand appears, why it appears that way, and whether it matters commercially, and being willing to act on what that connection reveals.
Teams that run the three layers in isolation are more likely to ship disconnected work. Teams that run them together will know which lever to pull next.
Pick your metrics based on business importance. Report them with the right segmentation and confidence level. Interpret them with the right questions. And act on them by closing the structural, source, representation, or conversion gaps they expose.
It’s time to measure AI search in a way that supports better decisions.


