If you’re analyzing your website’s organic search traffic drop and want to assess if this is due to a Google update, or if it’s due to something else: a change in search visibility and CTR due to a search feature change, change in search behavior or seasonality… here are 7 key questions to ask and a mix of free and paid SEO tools to use to identify the cause, affected queries, pages, as well as to obtain the most important information to start taking action to optimize, in case the drop has been for relevant queries to continue targeting.
1. Is my organic search traffic drop correlated with a Google Search Update visibility change or major content change?
Use the Google Search Console along with the free GSC Guardian Chrome Extension, to easily see Google’s major updates overlaid along with your site performance metrics. I highly recommend doing this while filtering per country and device, as well as segmenting and analyzing branded vs non-branded, besides the overall evolution over time, to identify patterns.

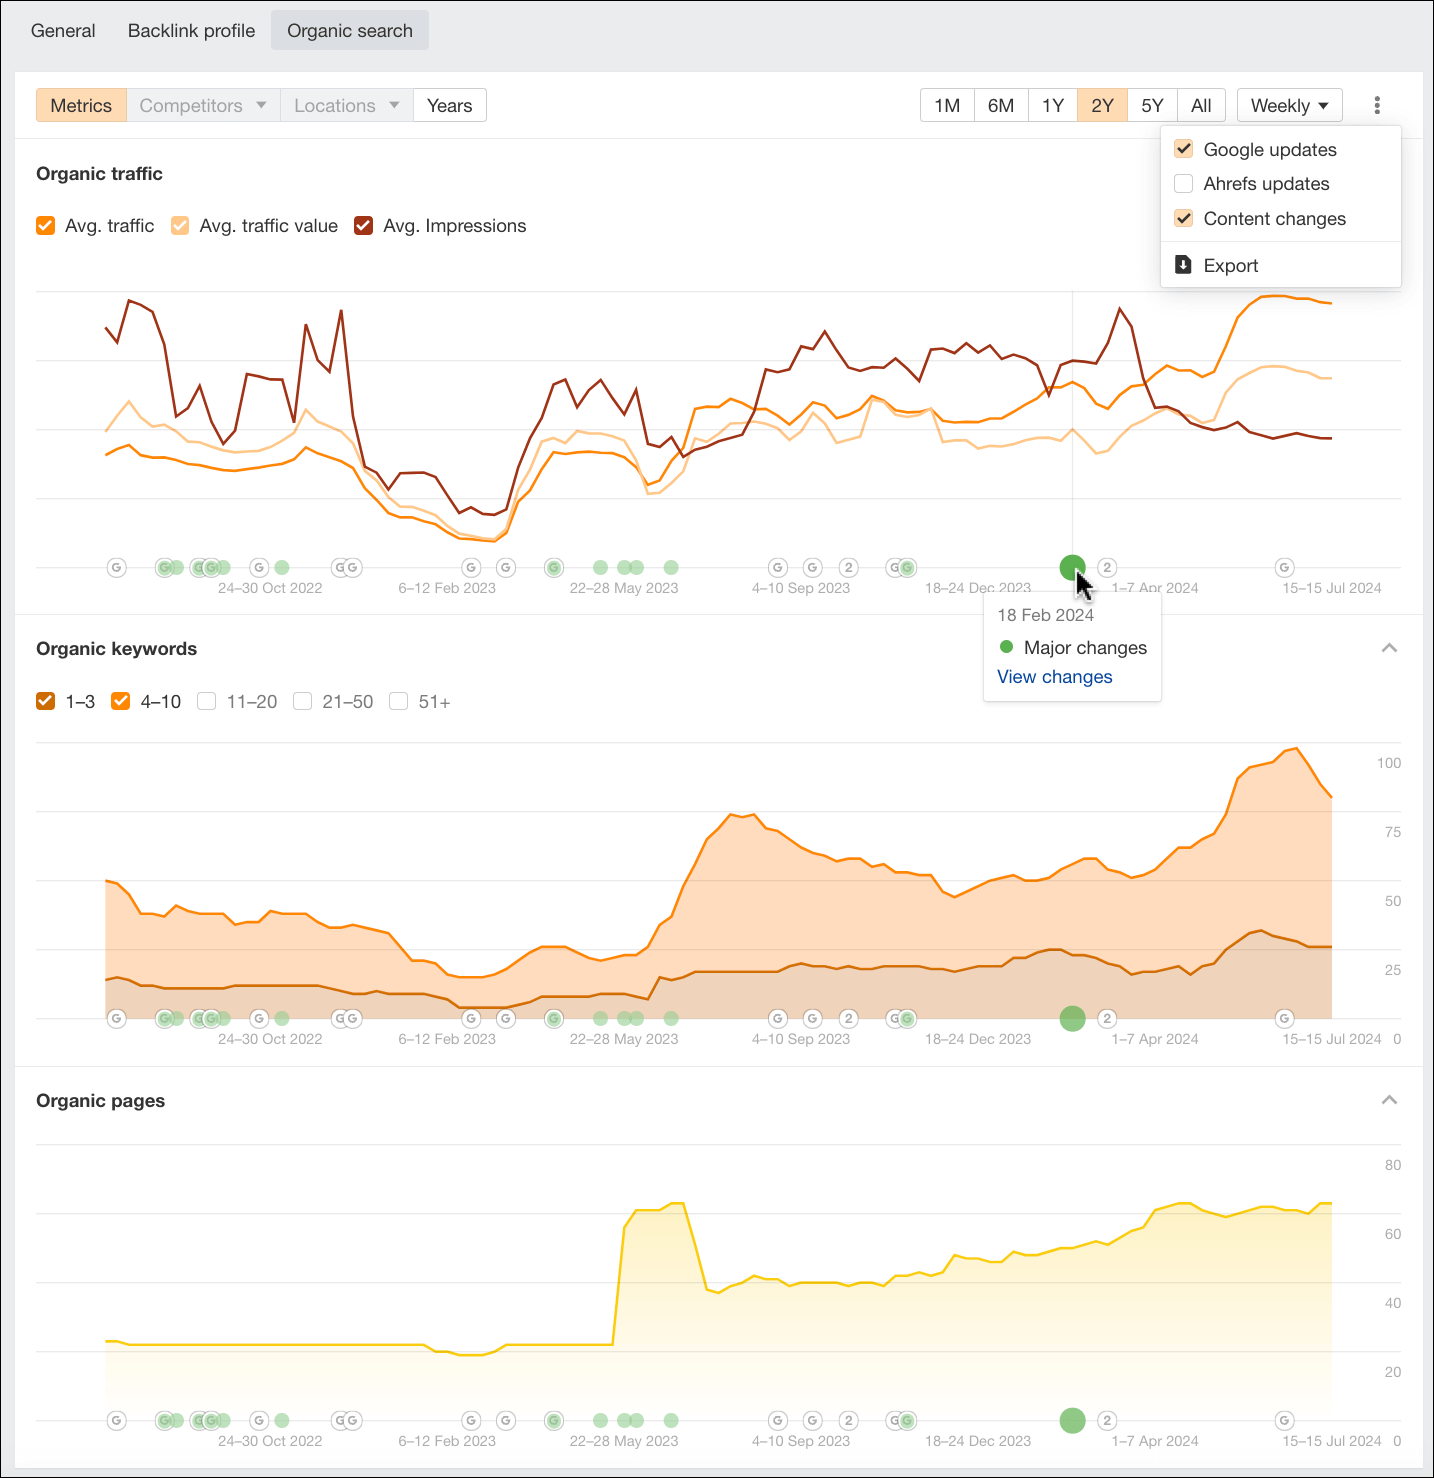
In Ahrefs “Overview” reports also allows you to easily see the overall evolution of organic search traffic (and impressions) vs ranked keywords vs pages, along with Google Updates and your own site pages content changes overlayed in the timeline, which can be pretty useful to not only spot a correlation from search updates but also your own major site releases (or even unwanted changes).
2. Which are the queries and pages that have dropped (and also increased) the most?
Once you’ve identified that there has been a decrease or increase you want to analyze, is time to identify which have been the affected queries and pages. You can use the comparison feature of the Google Search Console Report along with the free Google Search Console Enhanced Analytics for the desired time ranges, to not only obtain the numeric but also the percentage difference in clicks, impressions, average CTR or average position.
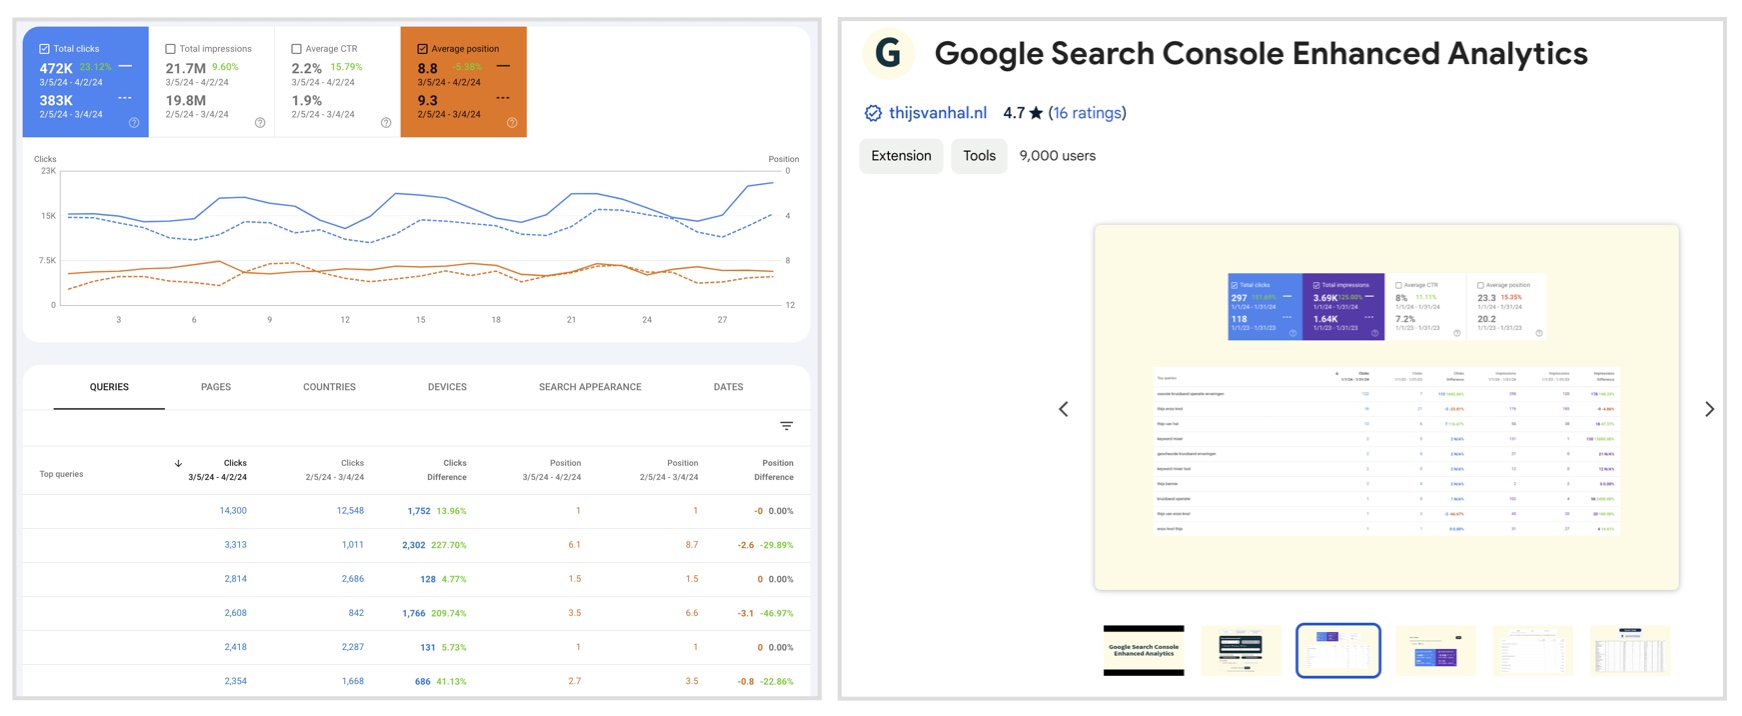
Besides segmenting for branded and non-branded queries, I also highly recommend to do this comparison per pages types separately too: listings, products, guides, etc. by segmenting per page URL structure, as well as search appearance by using the report filters, to identify patterns more easily.
3. Are the traffic decreases or increases correlated with a position shift or change of impressions and/or CTR only?
Export the comparison data to sheets to filter the data more easily, and identify which are those queries or pages that actually dropped in clicks due to a drop in average position, and those that while dropped in clicks, didn’t actually dropped in average position and the drop is instead correlated to a drop in impressions or CTR.
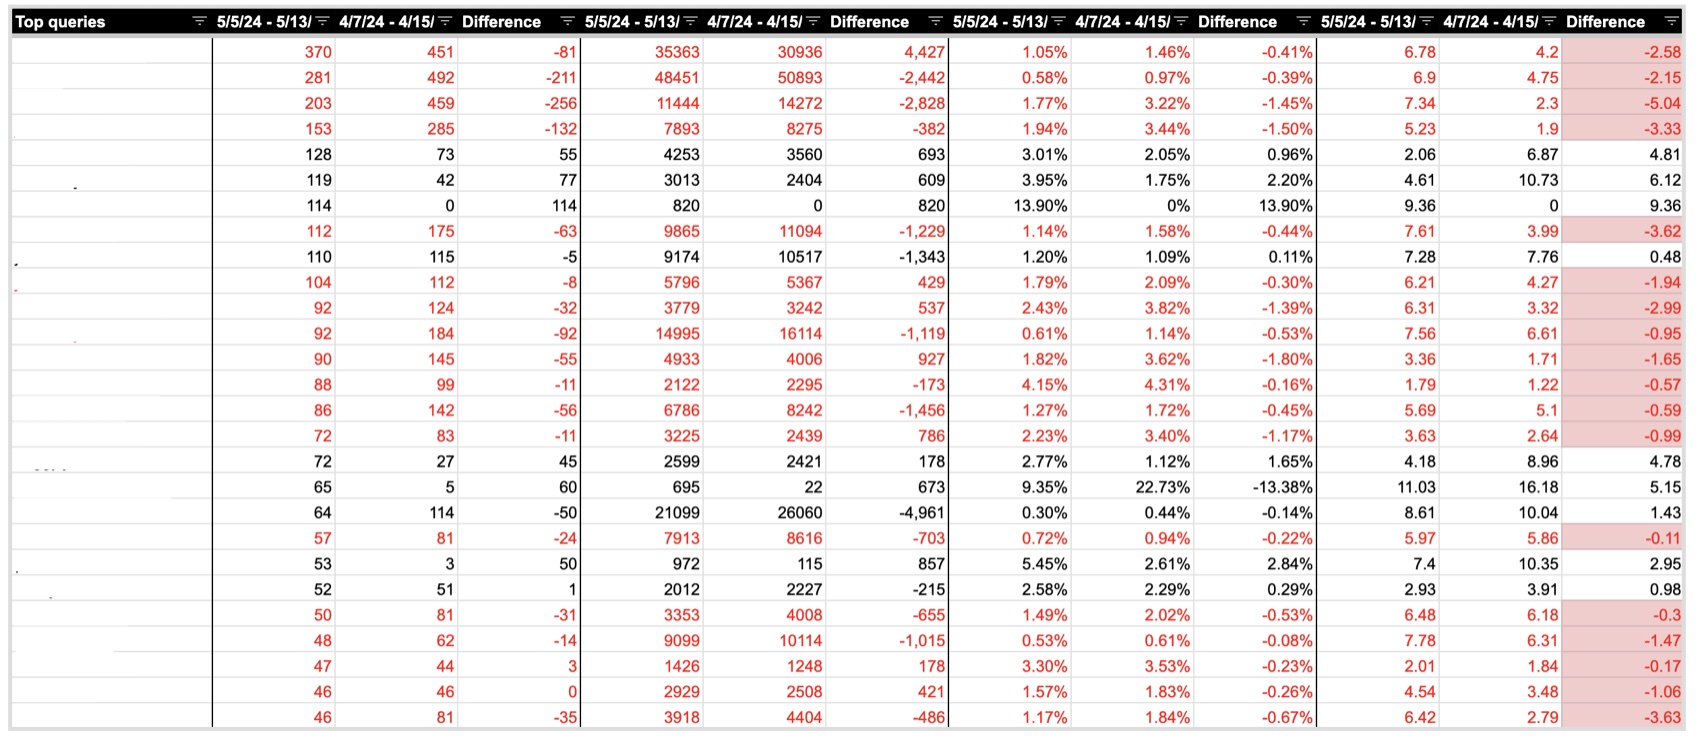
You can filter out queries/pages that are not meaningful to your analysis, depending on your goal, for example, if you’re looking to only identify those with traffic drops from actual ranking decreases.
Also, even if you’re looking to identify the affected queries and pages that dropped in rankings, it will be useful to also identify and analyze those that increased during the same time, to assess what’s different in these pages and queries vs those that dropped, and learn from it.
4. Has the traffic decrease been caused by a drop in SERP features?
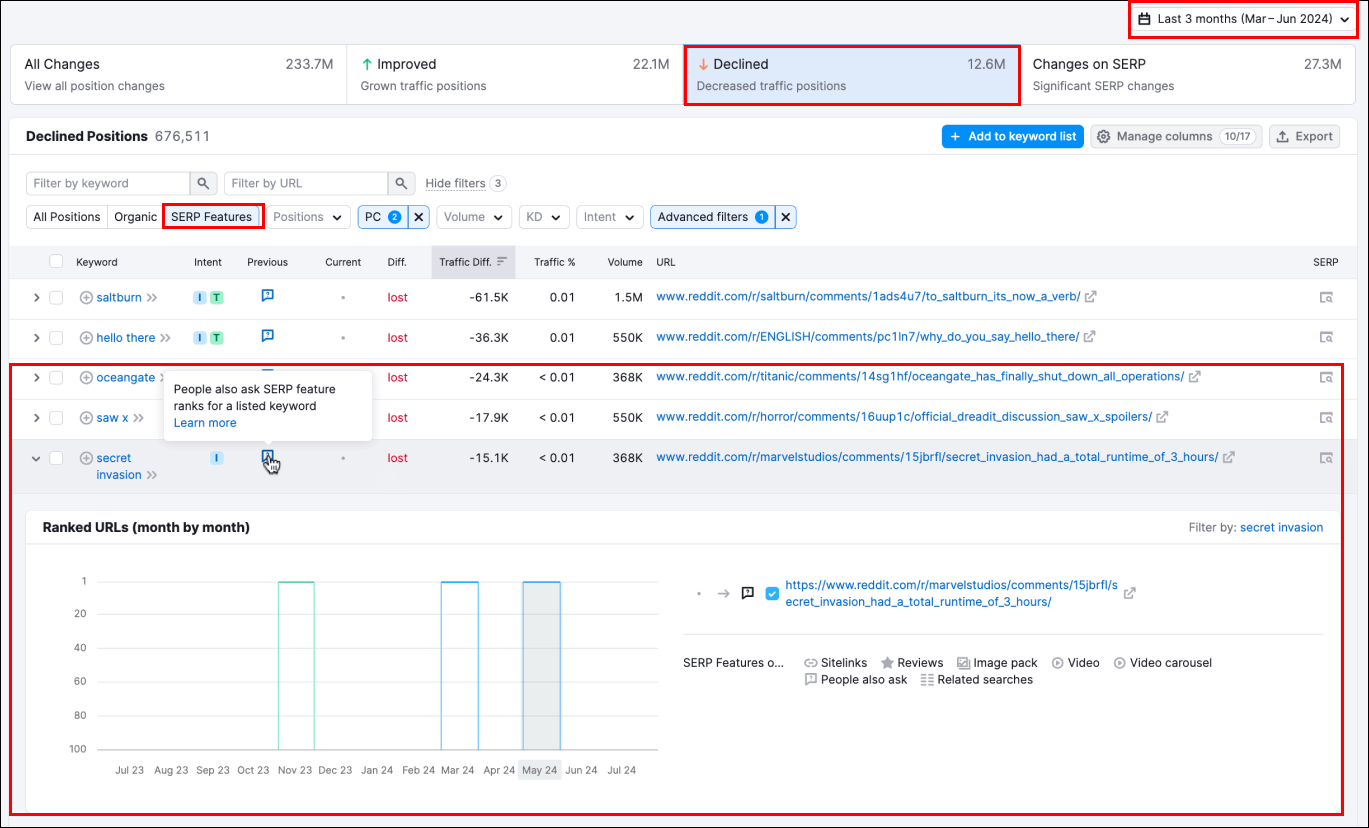
Unfortunately not all Search features are shown through the Google Search Console Performance report Search Appearance filter, so if you want to double check if a traffic drop is correlated with a drop in visibility of many of the other search features not shown in there, you can use paid tools that show and offer an easy comparison for them, such as Semrush Position Changes report, that has a “SERP Features” filter, showing the change in traffic along with the drop in search features for the selected time period.
5. Which pages have increased while yours decreased in rankings?
To assess why your pages dropped for your relevant, targeted queries, and what to prioritize to improve, it’s important to also identify and assessed what pages improved in rankings while you decreased, and the difference between your pages and them: from content type, format, experience, etc. it’s fundamental to do a comprehensive analysis. You can do this for your the top queries of different types using the SERP comparison or historical data that tools like Sistrix or Ahrefs offer.
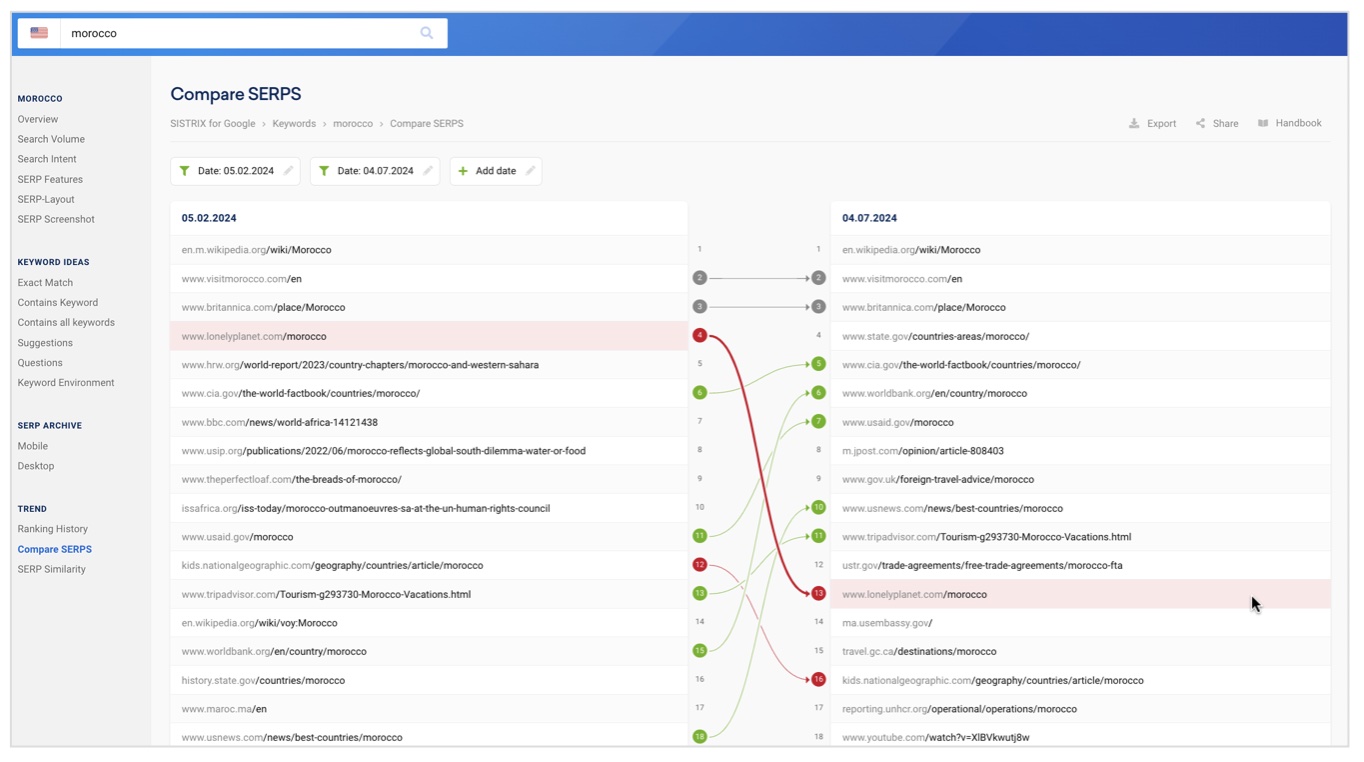
6. Which are the pages attracting more visibility for the group of queries that your pages decreased in rankings?
To better identify the content gap of your dropped content vs the winning one, you should also assess the pages that are getting now more visibility for the group of queries that your site decreased for. You can do this with tools like Advanced Web Ranking that have a “market share” report that you can set for any group of tracked keywords, that also show those URLs from the top winning sites attracting more visibility from the assessed queries.
Is there a clear pattern from these pages as well as parent sites now outranking you?
7. Which are the pages attracting most of the clicks for the pages yours decreased?
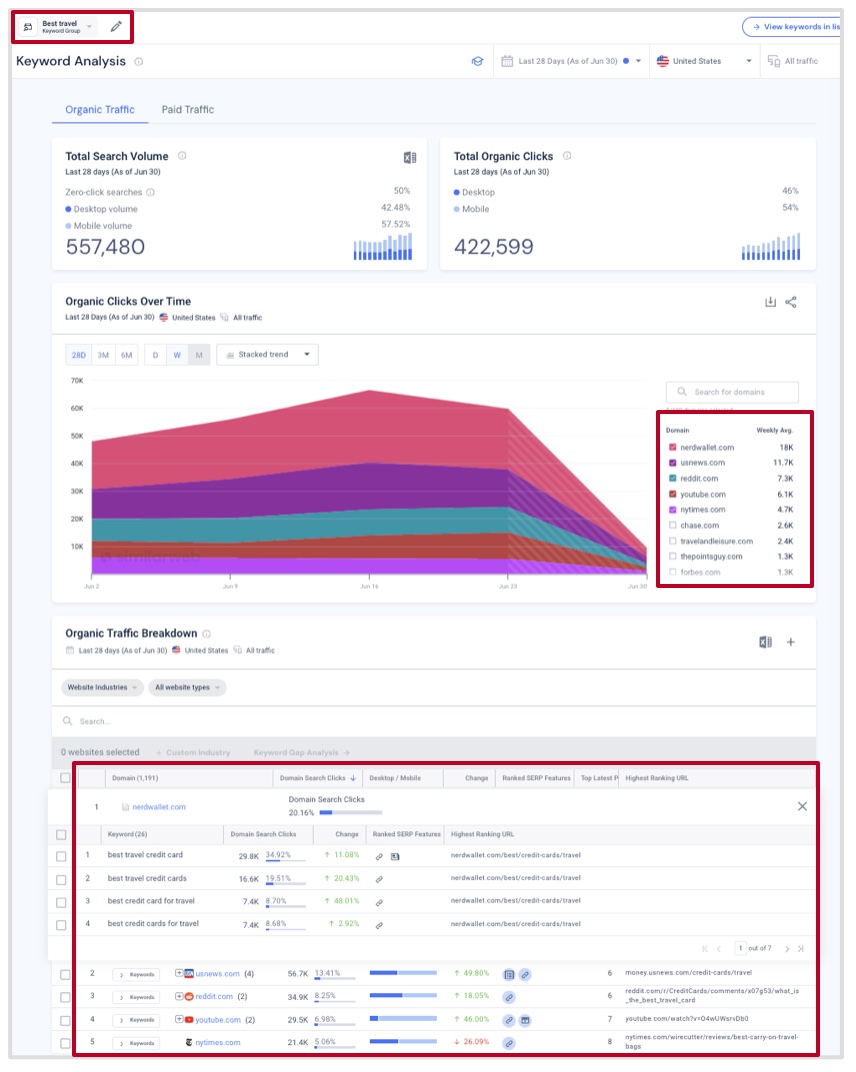
Beyond the ranking visibility: where are the clicks going? You can also assess those pages attracting the most clicks from the group of queries that you dropped for by using SimilarWeb keyword analysis report for a personalized keyword list, allowing to quickly see which are the winning pages attracting most of the clicks for the analyzed queries per site, along with the ranked SERP features.
It’s time to assess the potential causes of your rankings drops!
After answering the previous questions you should have a better idea if your site has actually been negatively affected by a specific update or not, or if your rankings have been actually dropped or if it has been a change in CTR due to a shift in search features. And if your rankings have actually dropped, you should now know for which queries and pages types, the main characteristics and differences vs those that improved from your own site and others, to establish a prioritized optimization or content creation action plan.
