I have a Google Looker Studio report that I’d like to share with you since it highly facilitates the usual analysis after a Google Algorithm Update happens.
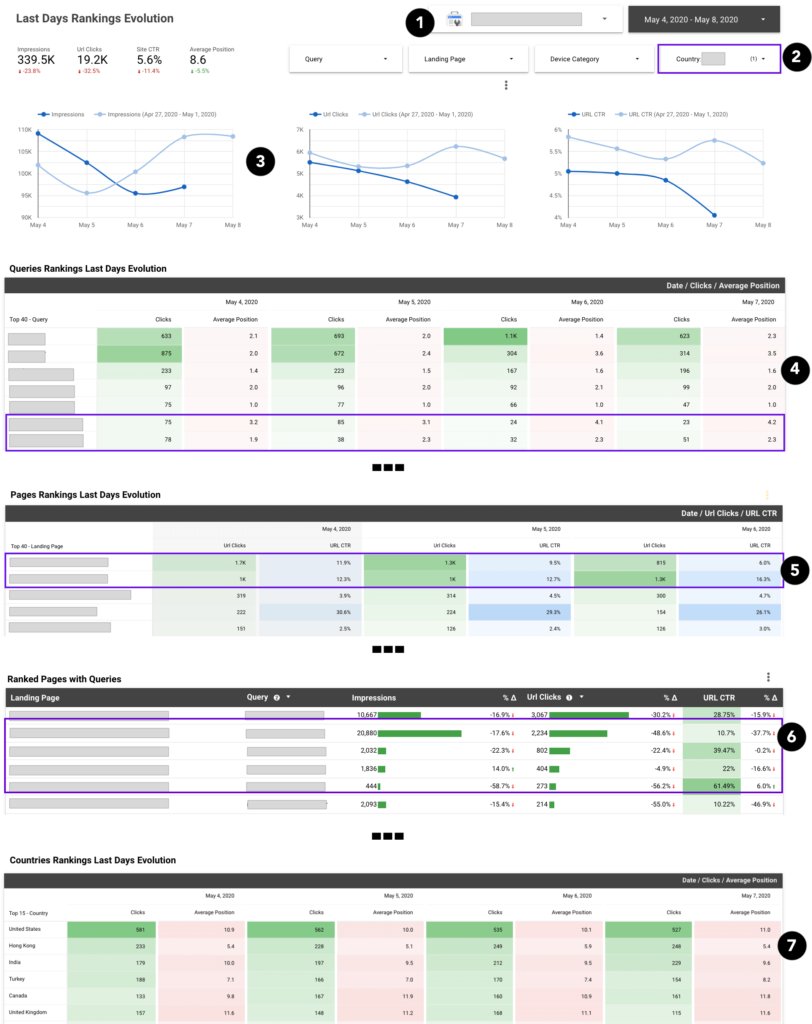
The report is configured and pre-segmented/filtered to easily show Google Search Console’s rankings evolution -at a site level as well as per query, pages and countries level- in the last 4 days (comparing it vs. the previous week), which allows to easily see if the site has been affected positively or negatively by an update, and which have been the top queries, pages and countries affected.
The Looker Studio Report -populated with Google Search Console data- will show the last 4 days of available data (until the day before the current one) and will compare it vs. the same period of the previous week, to easily spot a change in trend. With the report you can:
- Choose from any Website that you have access to in Google Search Console with a country selector.
- Check the specific evolution/data of a single or group of countries, devices, queries and pages with a country, device, query, and page selectors. I’ve found particularly useful to filter per country individually for each of my targeted markets, when doing the assessment to avoid seeing mixed data from many of them, as they might vary a lot.
- See the evolution in impressions, clicks and CTR from the last 4 days compared with those same days of the previous week.
- See the average position and clicks evolution for your top 40 queries in the last 4 days. This will allow you to easily see which have been increasing or decreasing in the last few days.
- See the clicks and CTR evolution for your top 40 pages in the last 4 days, which will allow you to see those most important pages that have decreased or increased the most in activity.
- See the top pages along their ranked queries and their increase or decrease in impressions, clicks and CTR, which will allow you to see specifically which are those queries for which the pages have lost or won for.
- See the average position and clicks evolution for your top countries in the last 4 days, handy in case you don’t filter the report per country and want to see which has been the position and clicks evolution for each of your country markets in a single place.

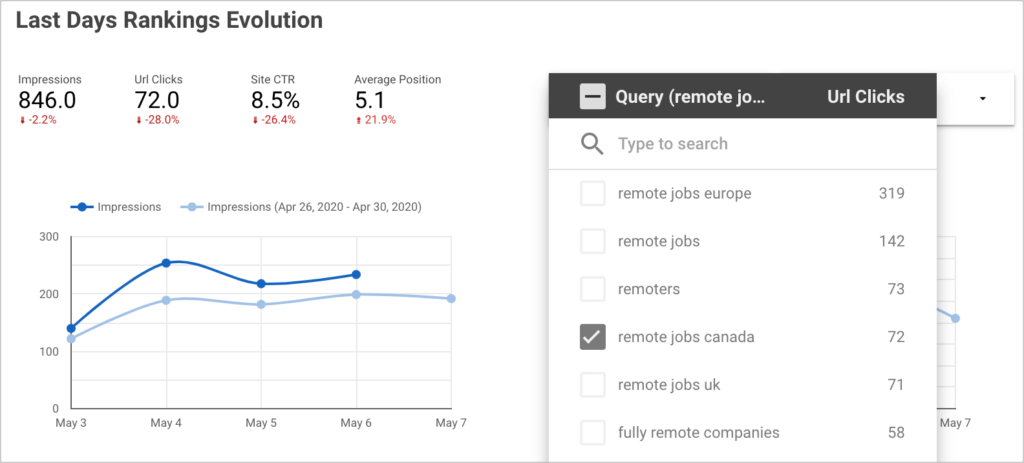
Besides quickly verifying the overall rankings trend per site, when I identify that there’s one that is being negatively or positively affected, what I tend to do is to identify which have been those specific queries and pages that have lost or won the most in the last few days:


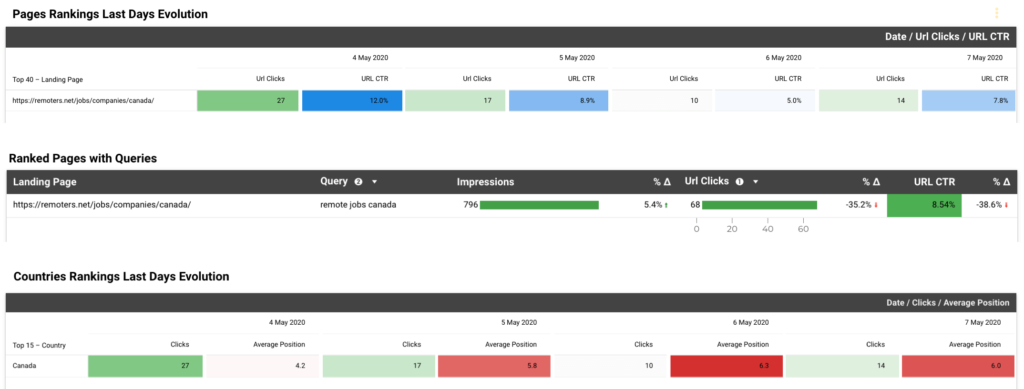
To then filter them out per affected queries to then see specifically which have been the specific pages for which they have lost (or won) with, as well as if this has been consistent or not across different countries, in case if has affected many and you haven’t pre-selected one too:


This organization and Looker Studio flexible filtering gives can highly facilitate an initial analysis to spot changes of trends with your own Google Search Console data, and can provide a good initial input for a bigger and more in-depth post Google Update SEO analysis.
Get the Looker Studio Report to use with your own Search Console data
You can copy the Looker Studio report to use it with your own search console by going here by clicking in the copy option shown in the top right area of the report as shown here:

Also, if you’ve liked and found this report useful, you might also like this other Google Search Console via Looker Studio Dashboard that I previously shared over here.
9 Comentarios
Thanks for sharing, this report is great!
Awesome report and super useful to use going forward.
Great report! Great help for a deeper analysis of changes in this update.
This is awesome! I am always looking for helpful resource to make this kind of work easier for me and my team. Great use of Data Studio.
I’m going to share this!
Thanks Aleyda this is great! Do u see this replacing your rank tracking software?
Hi Marcio, not really! It’s always good to have many different data sources to compare/validate 🙂
well surprisingly i inspired with the data you have collected and shows here, my business also suffer due to this update and i hope it will give update soon to cover this.
Thanks, Michael 🙂 Happy to hear!
Outstanding report. It answered my question of my rankings change. (That dynamically improved) you have a new follower.