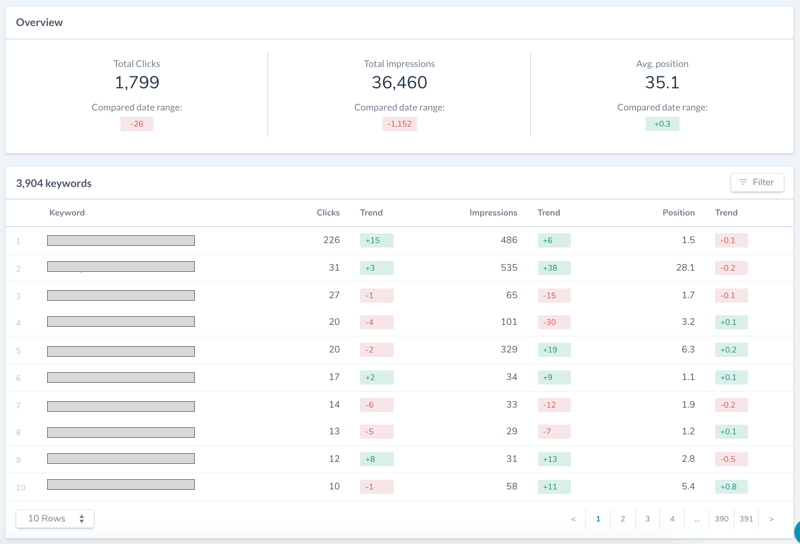
The Performance report of the new Google Search Console offers a much friendlier way to visualize and browse through the top organic search visibility data of our sites, which although limited -especially for bigger sites- offers us the most reliable source of Google’s ranking information, particularly helpful when analyzing the impact of search rankings updates (like the one that just happened at the beginning of August).
Nonetheless, despite having a friendlier interface than the previous one and being able to compare queries and pages related metrics between different time ranges, as François pointed out already in this post, it’s still not possible to directly obtain the change -whether as an absolute value or percentage- between them. Additionally, it’s not possible to visualize “by default” a list with the top pages along all the queries for which they’re ranking including their specific metrics, for which extra filtering is always needed.
There’s a rather easy and free way to overcome this “interface” challenge though, with Google Data Studio and its Google Search Console Connector, that allows to create a report with Google Search Console Performance metrics and dimensions, that cannot be only easily reused for all of the sites, but that can be also configured to directly show the metrics change over the selected time, as well as an overview of the top pages and their ranked queries that don’t require any filtering to easily spot opportunities and issues.
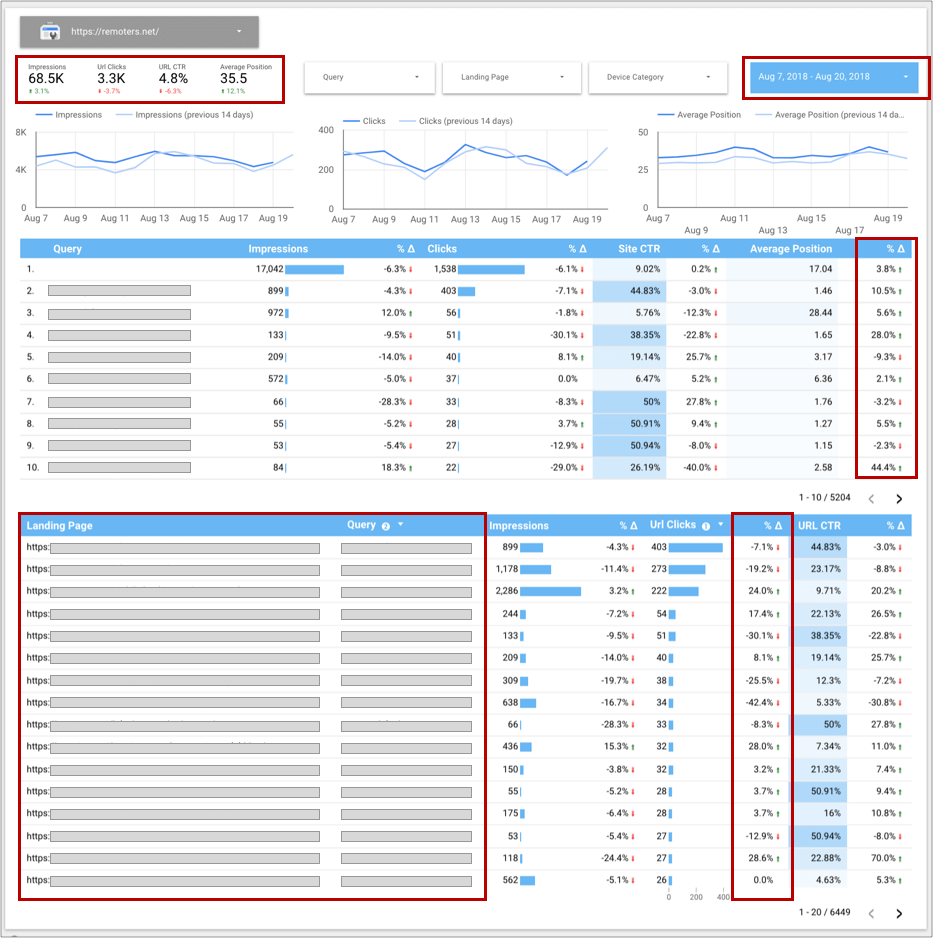
I know that many of you have already checked this “official” template for Google Search Console that Data Studio provides -which is great to use as a reference-, but it’s better to create your own that you can personalize to reuse across all of your sites (and share if you want) rather easily instead of the Google Search Console interface by adding the following areas(highlighted in the screenshot below) that will provide you directly more information:
- A data control, that will allow you to easily switch between properties and see the data for any of your Google Search Console sites.
- Filter controls in order to visualize in the report metrics per query, landing page or device category, if desired.
- A date range selector to be able to visualize -and compare- the data for your desired time range.
- A summary of the most important metrics -impressions, clicks, CTR, Average Position- for the selected time range, including to show the difference vs. the previous period, showing also a time series for the impressions, clicks and average position that facilitates to identify when the trend changes.
- A table -that allows paginations to see more data- of the site’s top queries with their impressions, clicks and average position along the difference vs. the previous period.
- A table of the site’s top landing pages including their ranked queries and impressions, clicks and CTR; as well as the difference vs. the previous period.
With a report like this, you will be able to not only obtain the information you can already with the Google Search Console interface but analyze the data more easily.
For example, you can order queries per clicks as well as impressions and then their positions, allowing to easily spot the most important queries with issues, like those that might have decreased more in positions with a high number of overall impressions, as well as those decreasing in impressions and clicks but not in positions -due to a change in search behavior for example-, facilitating the analysis.
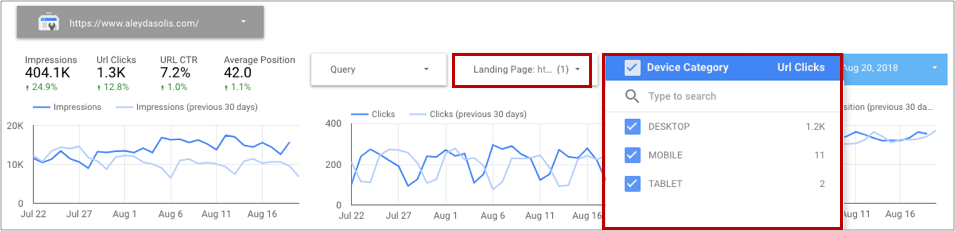
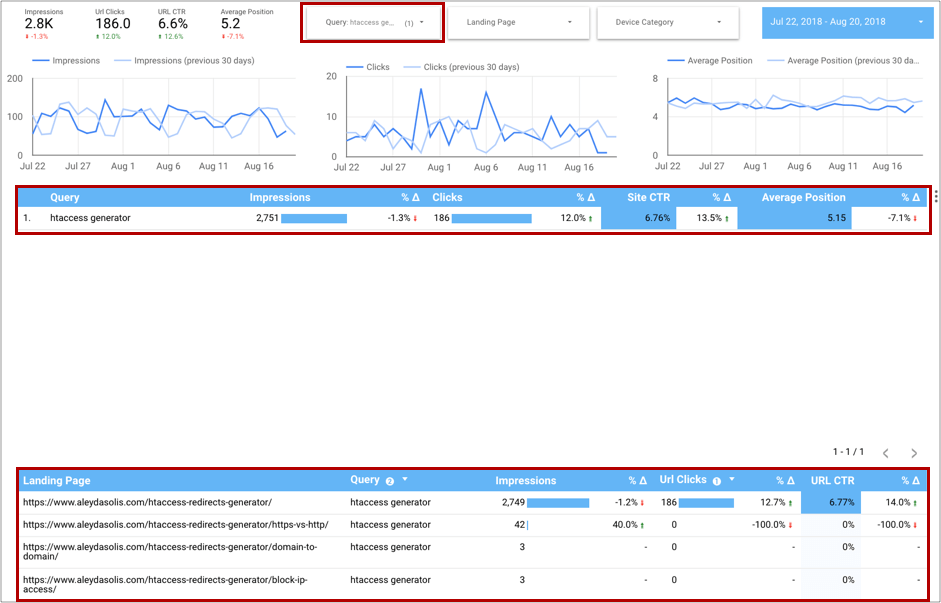
In case you need to specifically analyze the behavior of specific queries, pages or devices, you can use the filter controls to select them, as you do in the Google Search Console:
For example, you can choose a query that looks to have decreased in positions, but in clicks, to see which are the pages ranking for it, to identify if there are many -likely due to cannibalization issues- and which have been the ones decreasing in rankings, if the actually meant to be ranked one or any other.
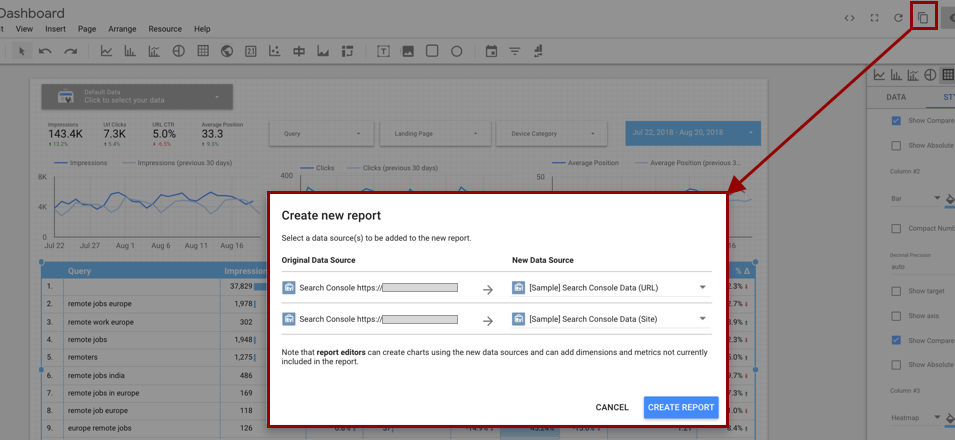
Copy the Google Data Studio report and use it as a template!
If you want to try it, you can get a copy of the report by going to this link and copying it (from the upper right copy option highlighted below) and create a new one using it as a template by selecting new Google Search Console URL and Site data sources of your own sites. I hope the report is as useful to you as it is to me!
Looking for other options?
If you want a more sophisticated, enterprise-focused solution, with more user-friendly, already segmented reports that are easier to filter, allowing you to save and keep your Google Search Console data, you should then check out Ryte’s Search Success module.