


Which pages help ChatGPT and Google AI Mode build their SaaS related answers? Which third-party sources reinforce those answers? And once a user (or increasingly an AI agent) decides to continue, where does the measurable referral actually go?
To answer these questions, I analyzed 15 leading SaaS brand and domain ecosystems across three US subverticals, combining Semrush citation data for ChatGPT and Google AI Mode with Similarweb AI referral data:
- CRM and Sales: Salesforce, Zoho CRM, Calendly, HubSpot and Apollo
- Project and Work Collaboration: Atlassian, Notion, Slack, Dropbox and Figma
- Accounting and Finance: Intuit, Zoho Finance, Xero, Wave and Ramp
The benchmark connects three parts of the AI search journey that are too often analyzed separately: the brand-owned pages earning citations, the external sources AI platforms use as supporting evidence, and the URLs receiving measurable AI traffic afterwards.
The results show that these layers frequently serve different purposes:
- The page that helps an AI system explain or recommend a product is not necessarily the page where the user (or agent) lands next.
- That destination depends much more on the SaaS category and the task still to be completed: evaluating a solution, reading support content, opening an app, authorizing an integration, accessing a workspace or completing a financial task.
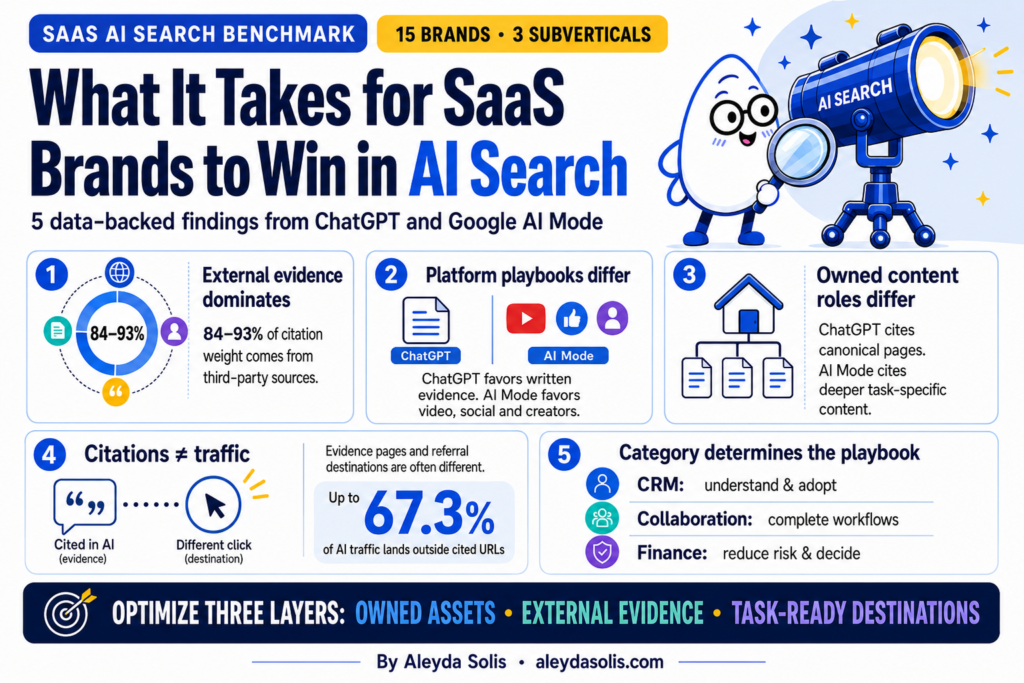
Across the 15 brands, five patterns were consistent enough to plan and optimize around. Here they are, along with the most important action each one requires.
1. Most AI citation weight comes from outside your own website
Across every subvertical and both platforms, third-party sources generate 84% to 93% of citation weight. Accounting and Finance has the strongest first-party contribution, roughly double the other two categories, because high-value support, tax and decision-support content often serves directly as answer evidence.
| Subvertical | ChatGPT owned | ChatGPT external | AI Mode owned | AI Mode external |
|---|---|---|---|---|
| CRM and Sales | 7.9% | 92.1% | 6.6% | 93.4% |
| Project and Work Collaboration | 8.1% | 91.9% | 7.8% | 92.2% |
| Accounting and Finance | 16.4% | 83.6% | 15.9% | 84.1% |
Publishing authoritative content on your own site is necessary but rarely sufficient. With 84 to 93% of citation weight sitting on third-party sites, the external ecosystem, such as documentation, communities, reviews, publishers, video and peer software sites, needs to be treated as a first-class AI visibility channel with its own strategy and owner, not a promotional afterthought. You need to:
- Map your category’s actual evidence ecosystem before investing: The source mix differs materially by category: specialist finance publishers in accounting, creators and technical communities in collaboration, review directories in CRM, and by platform. Audit which domains shape your highest-value prompts first; don’t inherit another category’s target list.
- Prioritize the pages AI systems reuse, not just the sites they cite: A small set of evaluative pages gets cited repeatedly in ChatGPT, while community visibility is built on volume across thousands of threads. One accurate, well-positioned placement in a repeatedly reused comparison page outweighs broad low-leverage coverage, and correcting how you appear there matters as much as appearing.
- Become a source for your category, not just your brand: Peer software vendors are the largest classified source type in ChatGPT across all three subverticals (~25% of head source mentions). Original research, benchmarks, calculators and integration documentation can earn citations in answers about the entire category, including questions about your competitors.
- Build the video layer for AI Mode: Video is near invisible in ChatGPT’s evidence mix (~1%) but the largest external ecosystem in AI Mode (~23%). Tutorials, demos and walkthroughs aren’t brand marketing here, they’re citation assets.
2. ChatGPT and AI Mode rely on different types of external evidence
The two platforms build answers from different evidence ecosystems: ChatGPT leans on structured written sources; AI Mode gives far greater prominence to video, creator and social content.
| External evidence ecosystem | Nature of the evidence | ChatGPT (avg. share) |
AI Mode (avg. share) |
Primary role in AI answers |
|---|---|---|---|---|
| Peer software vendors | Vendor docs, integration pages, competitor content | 25.4% | 16.1% | Explains products, integrations and comparisons |
| Communities & forums | Reddit, Quora, technical forums | 14.4% | 11.4% | User experiences, recommendations, troubleshooting |
| Video platforms | YouTube | 1.0% | 23.0% | Tutorials, demonstrations, walkthroughs |
| Social platforms | LinkedIn, Facebook, X | 2.0% | 9.0% | Practitioner insights and discussions |
| Technology publications | TechRadar, PCMag, ZDNet | 7.7% | 0.5% | Editorial validation and comparisons |
| Review platforms | G2, Capterra, GetApp | 6.4% | 2.8% | Ratings and alternative discovery |
| Statistics & research | Statista, research sites | 5.5% | ≈0% | Factual support and market data |
| Creator platforms | Medium, Substack, blogs | 0.4% | 3.0% | Independent tutorials and commentary |
| Business publications | Forbes, Fortune, Inc. | 2.7% | 1.1% | Business context and validation |
| Specialist publications | Finance/accounting/SaaS media | 1.6% | 0.9% | Vertical expertise and guidance |
It’s necessary to run two distribution programs, not one: accurate inclusion in the concentrated set of reusable evaluative pages for ChatGPT; broad video, social, community and creator coverage for AI Mode.
- Structure and resource them as genuinely different programs: ChatGPT’s evidence concentrates in written, evaluative environments like technology publications (7.7% vs 0.5%), review platforms (6.4% vs 2.8%) and statistics sources (5.5% vs ≈0%); which calls for digital PR, placement accuracy and data publishing. AI Mode’s spreads across produced and participatory media, like video (23.0%), social (9.0%) and creators (3.0%), which calls for video production and community and creator relations. A single budget line will systematically underfund one of the two.
- Treat communities as the shared foundation: Communities and forums are the only ecosystem with double digit share on both platforms (14.4% / 11.4%). Sustained, authentic participation in Reddit and your category’s technical forums compounds across both, and unlike placements, it can’t be bought quickly, so it’s the investment to start earliest.
- Match the asset to the evidence role, not the channel. Each ecosystem plays a distinct role in answers: reviews drive alternative discovery, video carries demonstration, communities carry real user experience and troubleshooting. Repurposing one blog post across every channel misses the role: build the demonstration as video, the experience through community presence, and the evaluation through review-platform accuracy.
- Don’t write off a source type because one platform ignores it. Technology publications are near-invisible in AI Mode (0.5%) yet a top written ecosystem in ChatGPT; social shows the reverse pattern. Judge every placement against the platform it actually serves, and report visibility per platform, never blended.
3. ChatGPT and AI Mode also cite different parts of your own website
ChatGPT anchors on canonical brand surfaces: root URLs carry 14.7 to 17.7% of its citation weight, versus just 0.8 to 4.1% in AI Mode. AI Mode instead concentrates 69 to 76% of its weight on URLs two to three path segments deep, where guides, documentation, templates and comparisons live. That’s descriptive of the content it selects, not evidence that deeper architecture causes citations.
| Owned page type | ChatGPT (range across subverticals) | AI Mode (range across subverticals) |
|---|---|---|
| Corporate homepage | 13.7% – 16.9% | 0.4% – 4.0% |
| Help / documentation | 19.7% – 26.6% | 14.8% – 17.1% |
| Editorial & guides | 15.5% – 24.9% | 25.0% – 34.9% |
| Product / solution pages | 8.3% – 22.0% | 5.2% – 18.3% |
| Templates, tools & reference | 1.8% – 12.9% | 2.7% – 20.5% |
| Comparisons & listicles | 2.6% – 5.2% | 7.2% – 7.6% |
| Community | 0.2% – 3.2% | 0.4% – 14.5% |
| Academy & training | 1.5% – 4.3% | 0.8% – 6.2% |
You need to build both layers: a strong canonical core that ChatGPT reuses, and the task-specific system that AI Mode selects, internally linked so evidence pages lead to the commercial next step.
- Treat your homepage and product hubs as ChatGPT citation assets and keep them answer ready: Corporate homepages carry 13.7 to 16.9% of ChatGPT’s citation weight but as little as 0.4% in AI Mode. That means the canonical surfaces most teams treat as static brand real estate are actively used as evidence: keep positioning, capabilities, pricing signals and product names current and unambiguous, because outdated homepage copy becomes outdated answer copy.
- Make help and documentation a first-class content investment, not a cost center: It’s the most consistently cited owned content across both platforms (19.7 to 26.6% in ChatGPT, 14.8 to 17.1% in AI Mode), the only page type that never drops below double digits. Support content deserves the same editorial standards, ownership and update cadence as marketing content, because it’s doing marketing’s job inside AI answers.
- Build editorial as the AI Mode growth engine: Guides are AI Mode’s single largest owned evidence type (25.0 to 34.9%, versus a materially lower ChatGPT share) and the clearest case where the two platforms reward different investment. Structure them around specific tasks and decisions at the depth where AI Mode concentrates, not thin top-of-funnel posts at the root.
- Add the formats most SaaS content strategies skip: templates, tools, comparisons and community. These are AI Mode’s differentiated layer: templates and reference content reach 20.5% and community 14.5% of its weight in Project/Collaboration, and comparison pages more than double their ChatGPT share (7.2–7.6% vs 2.6–5.2%). Utility content and community spaces earn citations that blog posts can’t, and honest comparison pages let you supply the evidence for evaluation prompts instead of leaving it entirely to third parties.
4. The pages earning citations are often not the pages receiving AI traffic
Citations and referrals measure different stages: evidence versus next action. The gap widens as products become more operational and it’s the single strongest argument against treating citation counts as a traffic proxy.
| SaaS subvertical | Primary cited pages | Primary AI traffic destinations | AI traffic outside cited URLs | ChatGPT traffic on ChatGPT cited pages |
|---|---|---|---|---|
| CRM & Sales | Product, docs, support, academy, comparisons | Product, pricing, homepage, app access, account pages | 42.7% | 64.5% |
| Project & Work Collaboration | Docs, templates, integrations, workflow guides | Apps, workspaces, logins, OAuth/MCP authorization flows | 67.3% | 39.8% |
| Accounting & Finance | Guides, comparisons, support, calculators | Product pages, calculators, support, pricing | 22.4% | 76.6% |
Report citations and AI referrals as separate, connected KPIs and define destination quality by category.
- Kill the single “AI visibility” number in your reporting: A brand can influence the answer without receiving the click, or receive traffic on pages that were never cited, up to 67.3% of it in collaboration SaaS. Blending both into one metric hides which layer is underperforming: evidence (citations) or destination (referrals). Report them side by side, with the alignment rate between them as its own KPI.
- Shift expectations to your category before judging performance: The same alignment number means opposite things in different categories: 76.6% of ChatGPT traffic landing on cited pages is normal in finance, while 39.8% is normal in collaboration. Benchmark against your category’s baseline, not a generic target, a collaboration brand chasing finance-level alignment would be optimizing against its own product model.
- Use operational destinations as outcomes, not noise: In collaboration SaaS, apps, workspaces, logins and OAuth/MCP authorization flows are the primary AI destinations, often the most valuable events in the dataset, invisible in a conventional landing-page report. Track authorization completions, installs and workspace opens as AI-referred conversions, and connect referral data to product analytics to see them.
- Build the bridge between the cited page and the next action: The gap between evidence and destination is also a journey to design: cited guides, docs and comparisons should carry explicit, prominent paths to the pages traffic actually wants, pricing, product, signup, calculator or app access. Where a cited page has no commercial next step, the citation’s value stops at awareness.
5. There is no universal SaaS AI search playbook: optimize for your category’s primary job
AI systems consistently reward the content that helps users complete each category’s primary job: understand and adopt (CRM), complete workflows (collaboration), reduce risk and decide (finance). Copying another SaaS company’s editorial strategy optimizes for someone else’s answer space.
| Area | CRM & Sales | Project / Collaboration | Accounting / Finance |
|---|---|---|---|
| Dominant user job | Understand, compare and adopt | Complete workflows and integrate | Reduce risk and make financial decisions |
| Owned assets to prioritize | Product, support, academy, implementation and comparison pages | Documentation, templates, integrations, utilities and workflow guides | Guides, calculators, comparisons, compliance explainers and support |
| External priorities | Reviews, directories, peer vendors, publishers, communities | YouTube, creators, Reddit, technical communities, peer tools | Specialist finance publishers, peer vendors, reviews, communities |
| Likely AI destinations | Product, demo, support, app and account pages | OAuth, MCP, installation, app and workspace URLs | Homepage, product, support, filing and calculation resources |
| Primary KPIs | Demo, signup, pipeline, app access, support resolution | Authorization, install, activation, workspace and retained use | Signup, filing, calculator use, support completion, account access |
| Main reporting risk | Mixing customer/account and suite traffic with marketing demand | Treating product activation as ordinary referral traffic | Treating broad suite or sub-brand traffic as category demand |
Before writing a single new page, name your category’s main job and audit whether your cited pages, external sources and destinations actually serve it.
- Run the table above as a gap analysis, not a reference: Score your current state against each row of your category’s column: which of the priority owned assets exist and earn citations, and which external priorities you already have presence in. Invest where your column is weakest, the benchmark’s most consistent lesson is that categories underperform on predictable, different rows.
- Inventory your existing content by the job it serves, then stop producing for someone else’s: Most SaaS content calendars are built by imitation, which is how collaboration companies end up with thought leadership essays while their templates and docs go unmaintained, and finance brands publish trend posts instead of calculators and compliance explainers. Classify what you have against your main job (understand and adopt / complete workflows / reduce risk and decide), and redirect the budget from mismatched formats to the cited ones.
- Define success in your category’s native events before the program starts: The Primary KPIs row is the difference between an AI search program that survives its first quarterly review and one that doesn’t: judging collaboration SaaS AI traffic by demo requests, or finance by workspace activations, guarantees a false negative. Agree the conversion events, the same ones finding 4 tells you to use, with whoever owns the revenue number, up front.
- If you span categories, run one playbook per product line: Multi-product ecosystems were the benchmark’s biggest measurement trap: suite wide traffic mixed with category demand, sub-brands blended, customer and account activity counted as marketing. Each product line gets its own column, its own relevance rules and its own reporting, a blended average optimizes for a category that doesn’t exist.
The SaaS AI search action checklist
The five findings above describe how AI search behaves across top SaaS sub-verticals; this is what to do about it. Whatever your SaaS category, the sequence below is the same, what changes is where you’ll find the biggest gaps. Work through it in order: each step builds the foundation the next one measures.
- Strengthen the shared cited core first: The small set of URLs both platforms cite carries roughly half of all citation weight.
- Audit your external evidence ecosystem: Identify which vendors, communities, reviewers, publishers and creators shape your category’s answers, and correct inaccurate comparisons.
- Split distribution by platform: Concentrated evaluative placements for ChatGPT; video, social and community breadth for AI Mode.
- Make destinations task ready: Homepage, product, support, app, login, OAuth and workspace URLs should each serve the next step well.
- Protect data quality: Separate careers, customer generated URLs and product relevance, and know your tools’ sample sizes and export caps before trusting the numbers.
- Measure in layers: Citations, external authority, referrals and business actions as separate, connected KPIs with explicit denominators.
- Track trends, not snapshots: AI platforms change constantly, so one measurement can mislead. Repeat the same analysis on a regular schedule and pay attention to the direction, not the single number.
The bottom line
What gets cited across SaaS is consistently platform dependent; what receives the visit, and what that visit means, is category-dependent. So strengthen the owned assets that establish authority, improve the external environments that validate the brand, and make every destination useful, whether that’s a pricing page, a calculator or an OAuth flow. Then measure it in layers, because the brands that understand which layer is working will be the ones that compound while everyone else reports a single number that explains nothing.


