I’ve analyzed the biggest domain level visibility shifts in Sistrix for the US and UK during the May 2026 Core Update, with a measured window from May 26 to June 2, 2026. The rollout itself took place from May 21 to June 2.
One of the clearest patterns I’ve found when going through the winners and losers was that visibility often shifted toward the source type that looked like a stronger fit for the dominant intent, user market, and expected result format of each query set: more canonical, more local, more task-complete, or better aligned with what users were likely looking for.
This is what I’d describe as an intent-destination reset, a useful angle to understand why some highly authoritative domains lost, why some aggregators gained while others dropped, and why a broad “UGC lost” conclusion would be too simplistic.
The patterns that stood out most:
- Canonical reference brands gained while pronunciation tools, language Q&A sites and dictionary aggregators were more exposed.
- UK ecommerce and marketplace visibility shifted strongly toward local-market entities in the UK index.
- Category defining jobs and travel marketplaces gained, showing that “aggregators lost” is too simple.
- Forum, Q&A and open publishing surfaces declined, while large social, video and visual platforms were mixed to positive.
- Health and YMYL visibility split by source confidence and result fit, rather than by vertical alone.
Compared with the March 2026 Core Update, where visibility seemed to consolidate away from many intermediary, directory, broad aggregator and quick-answer layers toward stronger destinations, May looks like a more precise recalibration of which destination type Google prefers for each intent and market.
Some March losers recovered in May when they were category defining task destinations, especially in jobs and travel. Some March winners or stable authority sources slipped when they were no longer the best source type for the dominant intent, and May added a stronger localization signal, especially around local market ecommerce entities in the UK.
Overall, the clearest takeaway is that the May 2026 Core Update appears to have concentrated visibility around stronger default destinations for each query’s intent, market, and expected result type.
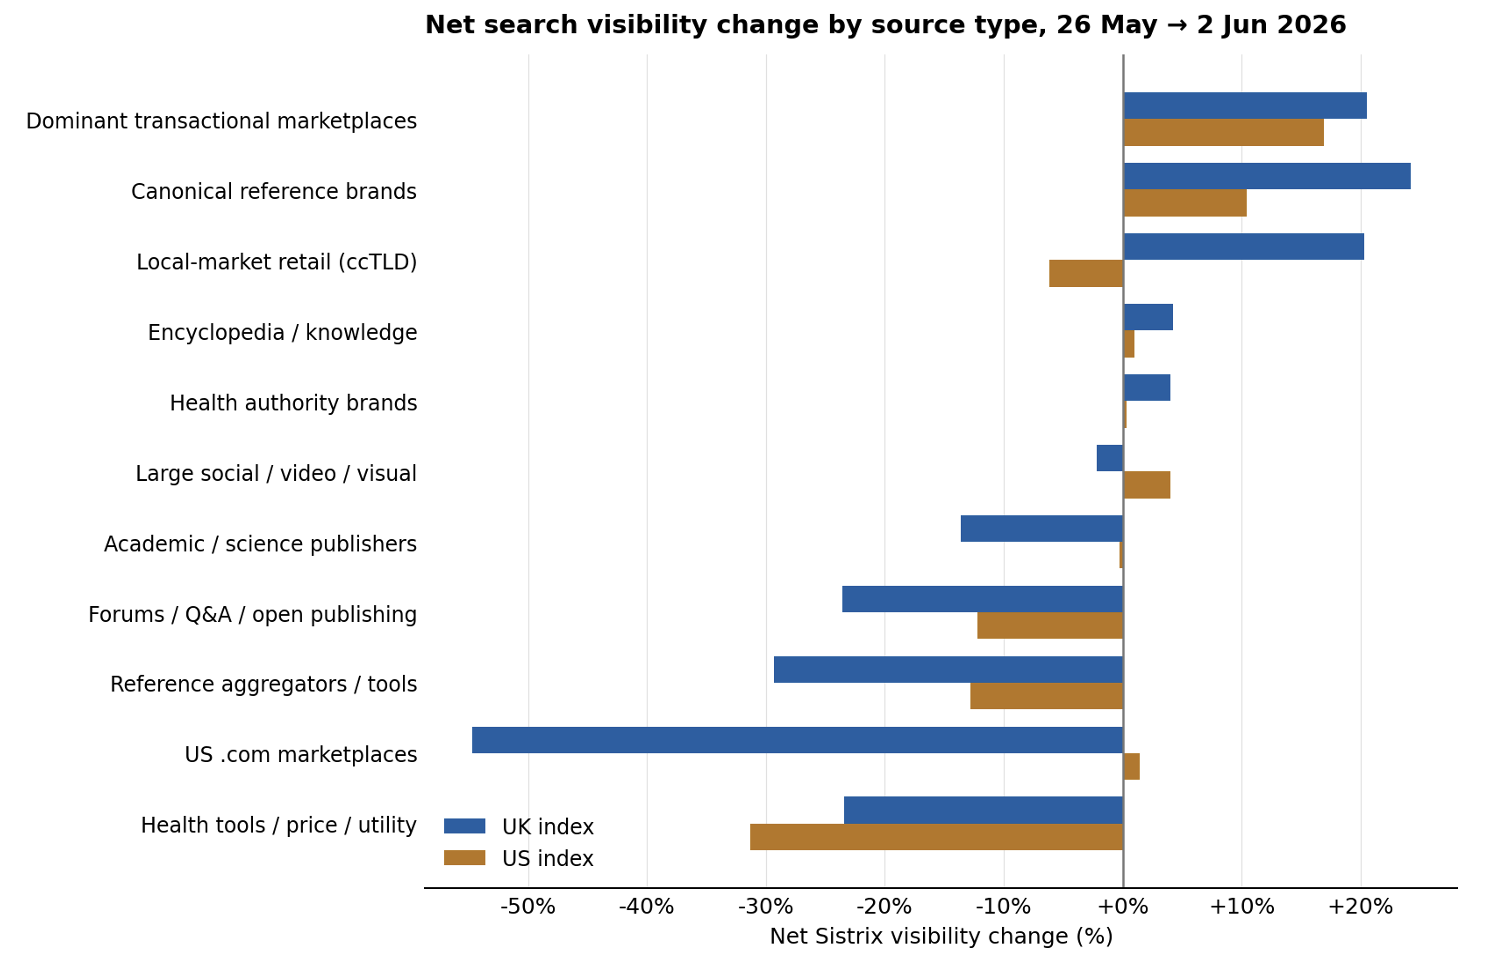
Figure 1. Net Sistrix visibility change by source type, UK vs US. The “US .com marketplaces” bar shows the localization mirror: they dropped sharply in the UK index, while holding in the US.
Let’s go through the biggest shifts by source type and market.
1. Source type fit mattered more than authority alone
Authority still mattered, but it didn’t explain the full picture: Several highly authoritative domains lost ground in the measured window, including nytimes.com, springer.com, nature.com, who.int, census.gov and nih.gov.
We need to stop benchmarking on authority in the abstract. For each priority query cluster, identify the result type Google rewards now: definition, explainer, product category, marketplace, official source, local result, video, tool, comparison — then confirm your ranking page genuinely IS that type, not a near match a stronger source already owns.
Reference is the clearest example because the query universe overlaps heavily: similar intents, opposite outcomes. Aggregated, canonical reference brands gained +24% in the UK and +10% in the US, while reference aggregators and tools fell -29% and -13%. The vertical didn’t win or lose as a whole; Google appears to have favored a different expected source type.
| Domain (UK index) | Change | Interpretation |
|---|---|---|
| cambridge.org | +40.9% | Canonical reference brand (UK) |
| thesaurus.com | +39.7% | Canonical reference brand (UK) |
| merriam-webster.com | +33.3% | Canonical reference brand (UK) |
| youglish.com | -69.6% | Pronunciation utility layer |
| forvo.com | -68.1% | Pronunciation aggregator |
| hinative.com | -62.9% | Language Q&A tool |
| onelook.com | -36.5% | Dictionary aggregator |
| wordreference.com | -35.0% | Secondary reference / forum layer |
The same logic shows up beyond definitions: genius.com held while lyric aggregators letras.mus.br (−49%) and lyrics.my (−43%) fell, and sciencedirect.com held while the scientific publishers above declined.
The useful question isn’t only “is this domain authoritative?”, but it’s “is this the expected source type for the query after the update?”
2. Forum and Q&A visibility contracted, while social/video platforms were mixed to positive
The pullback in forum, Q&A and open-publishing surfaces was clear: aggregated -24% in the UK and -12% in the US. Reddit, Quora and StackExchange all declined in both markets. Reddit’s percentage drop was smaller than some others, but its absolute movement was huge: roughly 408 visibility points lost in the UK and 361 in the US, because it sits among the highest-visibility domains in the index.
This is especially relevant because forums – Reddit above all – were structurally boosted through Google’s Helpful Content era and the “hidden gems” / first-hand-experience push of 2023-2024. This is the first update in a while where that exposure visibly contracted. Whether this is a durable correction or end-of-rollout volatility is one of the main patterns to re-check.
This was not a broad UGC decline. When the surfaces are separated, large social, video and visual platforms were flat to positive overall: aggregated +4% in the US and roughly flat (-2%) in the UK. YouTube, X and Facebook gained in the US; Pinterest and Fandom gained in both markets. Different format, different user expectation, different outcome.
| Domain | Change | Surface type |
|---|---|---|
| stackexchange.com | -31.8% | Forum/Q&A; US -18.3% |
| quora.com | -31.3% | Q&A; US -10.3% |
| reddit.com | -23.8% | Forum; US -13.7% (~408 / ~361 pts lost) |
| linkedin.com | -19.5% | Open publishing/profiles (UK); US flat |
| x.com | +14.5% | Large social (US) |
| pinterest.com | +9.7% | Visual (US +9.7% / UK +10.6%) |
| fandom.com | +5.6% | Community/visual (US +5.6% / UK +10.2%) |
If forum style or thin open publishing pages lost ground check whether Google changed the preferred result format. If the SERP now favors video, visual, official sources or canonical references, the challenge is competing in that format.
3. UK ecommerce visibility shifted toward local market entities
This was one of the most actionable international SEO patterns.
The UK index shows a clear rebalancing of ecommerce and marketplace SERPs toward local market entities and away from the .com version of the same brand. Local-market (ccTLD) retail rose +20% in the UK; US .com marketplaces fell −55% there.
The mirror holds in the US, where those .com domains are roughly flat and UK ccTLDs edge down, which is exactly what you’d expect if market fit, not the domain itself, is the lever.
| Domain (UK index) | Change | Interpretation |
|---|---|---|
| amazon.co.uk | +21.3% | Local-market entity favoured in UK |
| ebay.co.uk | +22.6% | Local-market entity favoured in UK |
| screwfix.com | +25.2% | UK retailer |
| amazon.com | -54.6% | US .com demoted in the UK index |
| walmart.com | -59.5% | Non-local marketplace for UK users |
| ebay.com | -53.7% | US .com demoted in the UK index |
| alibaba.com | -55.3% | Non-local marketplace for UK users |
For international ecommerce, audit wrong-market ranking, hreflang and canonical consistency, local entity clarity, and country specific signals: inventory, currency, pricing, shipping, returns, local reviews and support.
The question Google seems to be answering: is the local page genuinely the best result for users in that market?
4. Jobs and travel marketplaces show why “aggregators lost” is too simple
Jobs and travel are the clearest counterexample to a simple “aggregators lost” interpretation.
Category defining transactional marketplaces gained in both markets – aggregated +21% in the UK and +17% in the US – while the informational and utility-style aggregators fell. The distinction isn’t aggregator vs non-aggregator. It’s primary task destination vs derivative layer: the place users can complete the task, versus another layer summarizing it.
| Winning transactional destination | Change | Why it fits |
|---|---|---|
| trip.com | +82.2% | ravel marketplace (US); UK +33.9% |
| skyscanner.com | +47.1% | Travel meta-search (US) |
| ziprecruiter.com | +44.8% | Jobs marketplace (US) |
| expedia.co.uk | +38.1% | Travel OTA (UK); US +23.2% |
| glassdoor.com | +36.6% | Jobs/research destination (US) |
| indeed.com | +25.9% | Jobs (UK +26% / US +24%) |
| booking.com | +15.4% | Accommodation marketplace (UK +15% / US +13%) |
If your model aggregates information, benchmark against the sites that gained: are you where users complete the task, or a layer summarising it? This is most urgent for affiliate, comparison, reference and tool sites: a derivative layer now needs a much stronger reason to exist in the SERP.
5. Health was sorted by confidence and result fit
Health didn’t win or lose as a vertical, it split by source confidence AND result fit.
Trusted health destinations generally held or rose: webmd.com +8.8% UK / +5.7% US, with Cleveland Clinic, Healthline and NHS broadly stable-to-positive.
At the same time GoodRx and UbieHealth fell sharply, especially in the UK, and even authority sources slipped (who.int −9.3% UK / −12.5% US; nih.gov down in both).
The reinforcement of the core thesis: trust is necessary in YMYL, but preferred page type and query intent still decide the outcome. A global authority page, a symptom checker, a drug-price tool and a patient-friendly explainer are not interchangeable results.
| Domain | Change | Type / interpretation |
|---|---|---|
| goodrx.com | -80.0% | Drug-price utility (UK); US -17.5% |
| ubiehealth.com | -38.8% | Symptom-checker utility; US -38.9% |
| webmd.com | +8.8% | Trusted health destination; US +5.7% |
| who.int | -9.3% | Authority still exposed on intent mix; US -12.5% |
| nih.gov | -7.5% | Broadly stable; US -0.8% |
For YMYL, don’t stop at E-E-A-T signals and author bios. Validate whether affected queries now prefer a different source type, whether official guidance, patient-friendly explainers, medical institutions, tools, local services or fresher data, and whether your format still matches.
The bottom line
The May 2026 Core Update looks like a recalibration of which source type Google treats as the default destination for each intent. Canonical reference brands, local-market ecommerce entities and category-defining transactional marketplaces gained in the clearest examples. Forums/Q&A, wrong market domains, derivative informational tools and lower confidence utility layers were the most exposed.
It means the most useful question after this update is: for this query, in this market, in this result format – is my page still the best default destination?
![The AI Search Optimization Checklist – With Worksheet [Updated May 2026]](https://www.aleydasolis.com/wp-content/themes/aleydasolis/imgs/flecha.svg)


