We assume AI assistants surface the biggest brands, ecommerce concentrates around marketplaces, finance flows to trusted institutions, travel goes to the major OTAs, and the playbook is to “be a recognized brand.”
After going through the top click-producing AI search domains across ecommerce, finance, and travel & tourism in 10 international markets – the USA, UK, Spain, France, Germany, Italy, the Netherlands, Australia, Mexico, and Brazil – in March 2026, using Similarweb data covering roughly 87.6M visits across 57,696 domain-market entries, what stands out is that AI search isn’t one thing.
The shape of the click receiving layer changes radically by vertical and by country, and so does the strategy that actually works inside it.
Before I go through what the data shows, one important caveat that should sit underneath everything below.
What this data does and doesn’t show
These datasets capture click-producing AI search traffic: visits that landed on a domain after a user clicked a citation or link from an AI-generated answer. It doesn’t measure brand mentions or citations that didn’t generate a click, sentiment, or recommendation strength.
The analysis is based on third-party AI search referral traffic estimates for March 2026 across ecommerce, finance, and travel & tourism across ten markets (USA, UK, Spain, France, Germany, Italy, Netherlands, Australia, Mexico and Brazil) from Similarweb.
It also blends across AI surfaces that behave very differently — ChatGPT, Perplexity, Google AI Mode, and other AI search experiences don’t feature links and generate clicks in the same way. So when I say a domain “wins” AI search in a market, I mean it wins within the measurable click-producing layer. That’s an important slice of the picture, but not the whole one.
One methodological note: the domain counts below are domain-market entries, not necessarily unique domains. A domain can appear in more than one market or vertical. The industry categories are also based on the classification available in the dataset, so broad buckets such as generic finance or generic travel should be read as broad category groupings rather than precise user-intent labels.
The dataset overall:
| Vertical | Total AI clicks (10 markets) | Domain-market entries in dataset |
| Ecommerce | 39.3M | 14,454 |
| Finance | 30.7M | 22,313 |
| Travel & tourism | 17.6M | 20,929 |
| Total | 87.6M | 57,696 |
?
With that on the table, here’s what the data actually shows:
Pattern 1: AI search concentration isn’t the same across verticals, it’s an order of magnitude different
The most useful insight: How few domains it takes to capture the first 50% of clicks in a vertical.
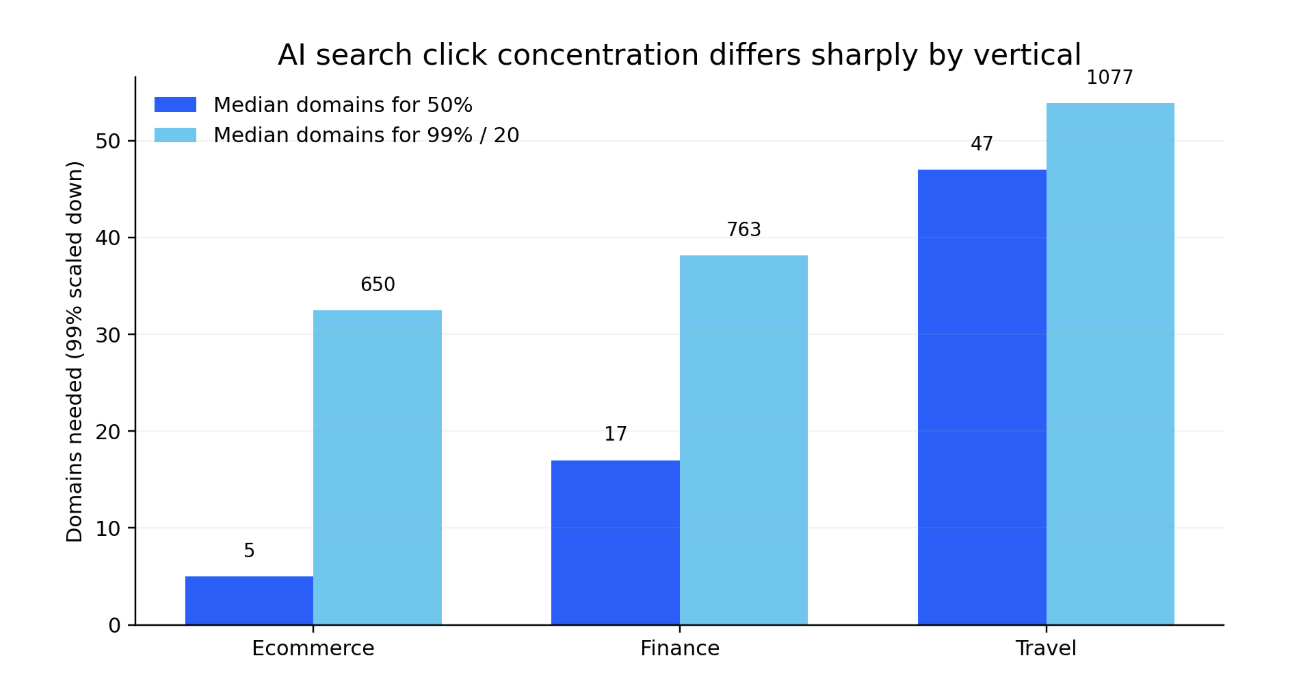
Figure 1. Vertical concentration gradient based on domains needed to capture 50% and 99% of AI search clicks in each vertical.
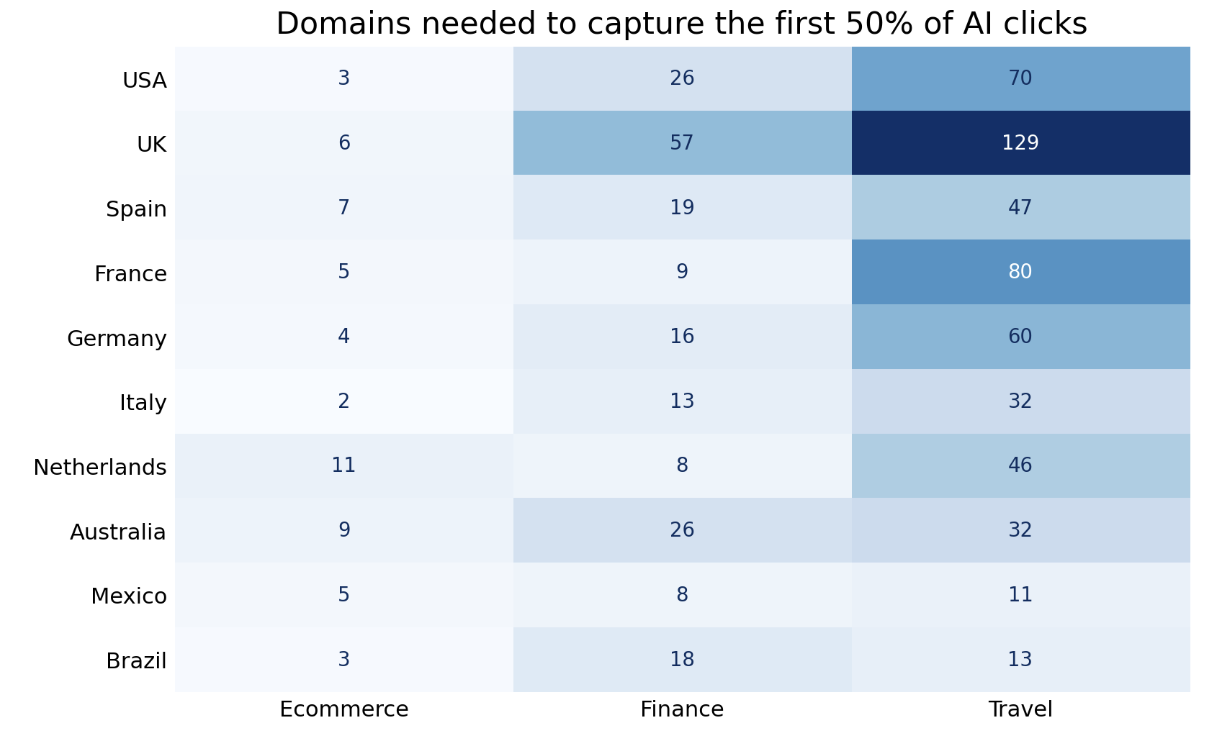
Figure 1B. Market-level concentration: domains needed to reach 50% of AI clicks by vertical.
| Vertical | Median domains for 50% | Median for 99% | Avg #1 share | Avg top 10 share |
| Ecommerce | 5 | 650 | 26.9% | 63.9% |
| Finance | 17 | 763 | 18.1% | 44.2% |
| Travel & tourism | 47 | 1,077 | 6.9% | 30.0% |
In Italian ecommerce, Amazon.it alone captures 46.2% of all AI ecommerce clicks, and adding Temu pushes it past half. In US ecommerce, three domains capture 50%. In UK travel, you need 129. That??™s a structural difference.
The same shows up at every market level. Here are the domain counts needed for 50% of clicks per market and vertical:
| Market | Ecommerce | Finance | Travel |
| USA | 3 | 26 | 70 |
| UK | 6 | 57 | 129 |
| Spain | 7 | 19 | 47 |
| France | 5 | 9 | 80 |
| Germany | 4 | 16 | 60 |
| Italy | 2 | 13 | 32 |
| Netherlands | 11 | 8 | 46 |
| Australia | 9 | 26 | 32 |
| Mexico | 5 | 8 | 11 |
| Brazil | 3 | 18 | 13 |
The ecommerce column never exceeds 11. The travel column ranges from 11 to 129. Finance sits between them in nearly every market.
This is important because it changes what AI search optimization actually looks like by vertical:
- In ecommerce, AI traffic strategy is largely marketplace strategy. The head is highly concentrated and, in many markets, very difficult to displace. The realistic question for most brands isn’t “how do I win the head” but “how do I show up correctly inside the marketplaces and resellers that own it.”
- In finance, there are clearer leaders, but there’s still meaningful room beneath them, and those leaders change materially by country. PayPal leads finance in Germany and Italy. Stripe leads in markets where the click mix appears to include a stronger payment-infrastructure, merchant, or developer component. Local banks hold strong positions in Brazil, Australia, and the Netherlands.
- In travel, the head is much more open. No single domain owns the user journey, which means specialist, local, and route-specific players still have a real path to visibility.
Pattern 2: AI search traffic often go to local infrastructure, not global defaults
This is the pattern that surprised me most when I went through the data, and it’s the one I’d most like SEOs working internationally to internalize.
In most non-US markets, locally trusted domains, classifieds, public-sector entities, and infrastructure operators are beating, or competing seriously with, the global defaults at the head.
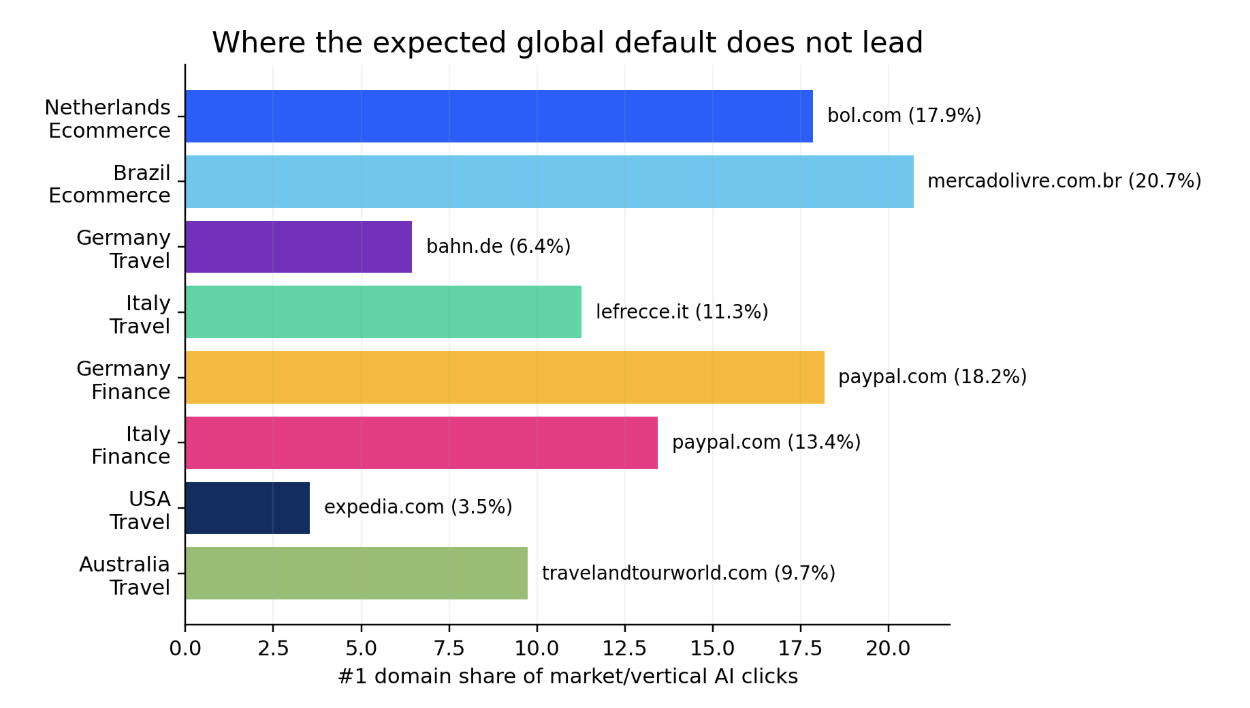
Figure 2. Examples where the leading AI-click domain isn’t the expected global default, based on the top domain by market and vertical.
Here are the cases where what you’d expect to lead doesn’t, ranked roughly by how much they break the assumption:
| Market | Vertical | Expected leader | Actually leads | #1 share |
| Netherlands | Ecommerce | amazon.nl | bol.com | 17.9% |
| Brazil | Ecommerce | amazon.com.br | mercadolivre.com.br | 20.7% |
| Germany | Travel | booking.com | bahn.de | 6.4% |
| Italy | Travel | booking.com | lefrecce.it | 11.3% |
| Germany | Finance | stripe.com | paypal.com | 18.2% |
| Italy | Finance | stripe.com | paypal.com | 13.4% |
| USA | Travel | booking.com | expedia.com | 3.5% |
| Australia | Travel | booking.com | travelandtourworld.com | 9.7% |
And once you go beyond #1, the pattern intensifies. Local infrastructure carries serious weight in the second tier of nearly every non-US market:
| Market | Notable local players in second tier (across verticals) |
| Spain | wallapop.com, chollometro.com, renfe.com, milanuncios.com, jcyl.es, barcelona.cat, civitatis.com |
| Germany | kleinanzeigen.de, idealo.de, geizhals.de, mydealz.de, check24.de, handelsblatt.com, fewo-direkt.de, muenchen.de, hamburg.de |
| France | leboncoin.fr, cdiscount.com, fnac.com, boursorama.com, ameli.fr, caf.fr, paris.fr, sncf-connect.com, iledefrance-mobilites.fr |
| Netherlands | marktplaats.nl, coolblue.nl, tweakers.net, hema.nl, belastingdienst.nl, abnamro.nl, ing.nl, ns.nl, amsterdam.nl, 9292.nl |
| Italy | subito.it, trovaprezzi.it, idealo.it, poste.it, ilsole24ore.com, trenitalia.com |
| Brazil | shopee.com.br, magazineluiza.com.br, olx.com.br, casasbahia.com.br, caixa.gov.br, serasa.com.br, nubank.com.br, latamairlines.com, voeazul.com.br, 99app.com |
| Mexico | liverpool.com.mx, walmart.com.mx, bodegaaurrera.com.mx, promodescuentos.com, bbva.mx, mercadopago.com.mx, volaris.com, vivaaerobus.com, aeromexico.com |
| Australia | bigw.com.au, kmart.com.au, ozbargain.com.au, myer.com.au, commbank.com.au, westpac.com.au, qantas.com, velocityfrequentflyer.com |
| UK | argos.co.uk, johnlewis.com, currys.co.uk, boots.com, gumtree.com, moneysavingexpert.com, tfl.gov.uk |
The pattern doesn’t appear to be explained by translation quality alone. It’s that those local domains often hold the structured inventory, operational data, or institutional trust that AI systems can rely on to answer the task in that market. For “Milan to Rome by train”, Lefrecce holds the timetables and routes. Booking.com doesn’t. For “best price in the Netherlands”, Bol.com has the local inventory and pricing. For “tax obligations as a freelancer in Spain”, the Spanish public-sector sites hold the answer no commercial intermediary can match.
The strategic implication: your global competitor set isn’t your AI search competitor set in each market.
In Italian travel, your real competitor for rail intent isn’t Booking, it’s Trenitalia. In Dutch ecommerce, it’s not Amazon, it’s Bol.com. In French finance, it might be Boursorama or even Ameli. International SEO frameworks built around global authority don’t capture this cleanly.
Pattern 3: “AI search is growing” is true, but masks meaningful churn
A common reading of month-over-month data is that AI search is in a uniform growth phase. The medians can make it look that way at first:
| Vertical | Avg median MoM (top 50) | Avg weighted MoM (top 50) |
| Ecommerce | +20.0% | +49.1% |
| Finance | +25.0% | +72.7% |
| Travel | +29.1% | +101.1% |
But the medians hide an important reality. In market after market, 30–40% of the top 50 domains are declining month-over-month, not growing.
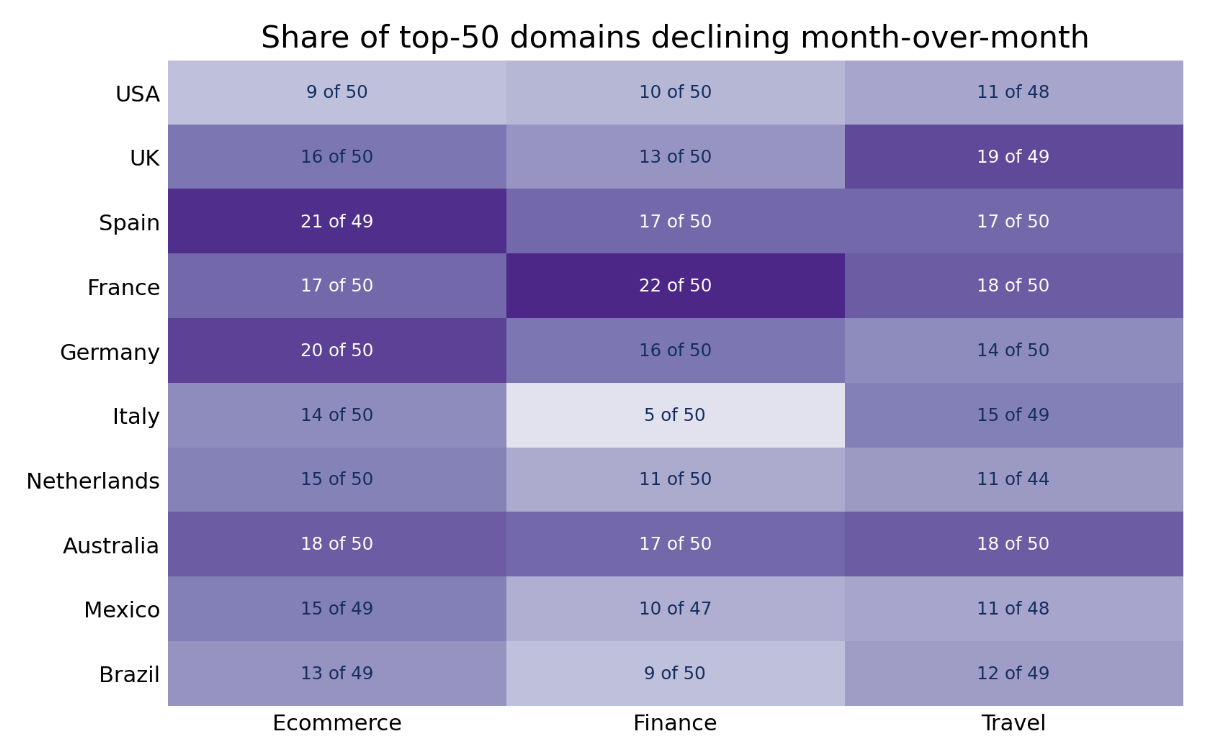
Figure 3. Declining domains among each market/vertical top 50, showing churn beneath aggregate AI search growth.
| Market | Ecommerce decliners | Finance decliners | Travel decliners |
| USA | 9 of 50 (18%) | 10 of 50 (20%) | 11 of 48 (23%) |
| UK | 16 of 50 (32%) | 13 of 50 (26%) | 19 of 49 (39%) |
| Spain | 21 of 49 (43%) | 17 of 50 (34%) | 17 of 50 (34%) |
| France | 17 of 50 (34%) | 22 of 50 (44%) | 18 of 50 (36%) |
| Germany | 20 of 50 (40%) | 16 of 50 (32%) | 14 of 50 (28%) |
| Italy | 14 of 50 (28%) | 5 of 50 (10%) | 15 of 49 (31%) |
| Netherlands | 15 of 50 (30%) | 11 of 50 (22%) | 11 of 44 (25%) |
| Australia | 18 of 50 (36%) | 17 of 50 (34%) | 18 of 50 (36%) |
| Mexico | 15 of 49 (31%) | 10 of 47 (21%) | 11 of 48 (23%) |
| Brazil | 13 of 49 (27%) | 9 of 50 (18%) | 12 of 49 (24%) |
The weighted averages are also distorted by individual outliers, a few domains growing +800% or +4,500% from a small base inflate the mean without reflecting what most domains are actually experiencing. Some examples worth looking at carefully:
| Market | Domain | MoM change | What to question |
| Brazil | azulviagens.com.br | +4,506% | Single-month spike, small previous base |
| Mexico | innovasport.com | +9,019% | Likely seasonal sports retail spike |
| Italy | joom.com | +778% | Cross-border marketplace — could be platform-side change |
| Spain | flightaware.com | +2,464% | Niche tracker, low absolute base |
| Australia | queensland.com | +2,267% | Seasonal/destination intent shift |
These movers are interesting and worth investigating, but a +4,500% single-month change on a small base doesn’t establish a structural trend. It establishes an investigation lead.
So the more accurate framing isn’t “AI search is growing.” It’s:
AI search is changing who receives traffic. The ecosystem of traffic receiving domains is expanding, but there is significant churn inside it. Current winners are not automatically safe, and baseline growth at the head is usually much more modest than the long-tail outliers suggest.
That changes the strategic implication. Position snapshots on their own aren’t enough. Momentum tracking matters more than position. The brands that need urgent attention are not the ones at #50 today, they’re the ones at #15 with a -25% MoM trend, because that’s where the position is actually being lost.
Pattern 4: “Trust-led finance” is real, but the headline is misread
Stripe ranks #1 in seven of ten finance markets in this dataset. That’s a real and important pattern, but it’s easy to misread it as “AI search rewards consumer trust in financial brands.”
A more careful reading is that Stripe’s prominence likely reflects B2B, developer, merchant, and payment-infrastructure demand rather than purely consumer financial decision making. The domain-level data does not let us fully separate those intents, so this should not be read as a simple consumer trust signal.
Here’s where Stripe and PayPal sit across all 10 finance markets:
| Market | #1 finance domain | #1 share | Stripe rank | PayPal rank |
| USA | citi.com | 11.9% | #2 | #5 |
| UK | stripe.com | 13.9% | #1 | #2 |
| Spain | stripe.com | 15.4% | #1 | #2 |
| France | stripe.com | 17.6% | #1 | #2 |
| Germany | paypal.com | 18.2% | #2 | #1 |
| Italy | paypal.com | 13.4% | #2 | #1 |
| Netherlands | stripe.com | 26.8% | #1 | #3 |
| Australia | stripe.com | 16.9% | #1 | #9 |
| Mexico | stripe.com | 29.1% | #1 | #14 |
| Brazil | stripe.com | 17.5% | #1 | #41 |
The “Stripe wins finance” headline is technically correct but too broad. PayPal, which is more consumer-facing, leads in Germany and Italy, while Stripe’s leadership in several other markets likely reflects the weight of payment-infrastructure, merchant, and developer oriented demand inside the finance dataset, not just consumer finance behavior.
Once you separate B2B infrastructure from consumer finance, the pattern becomes clearer:
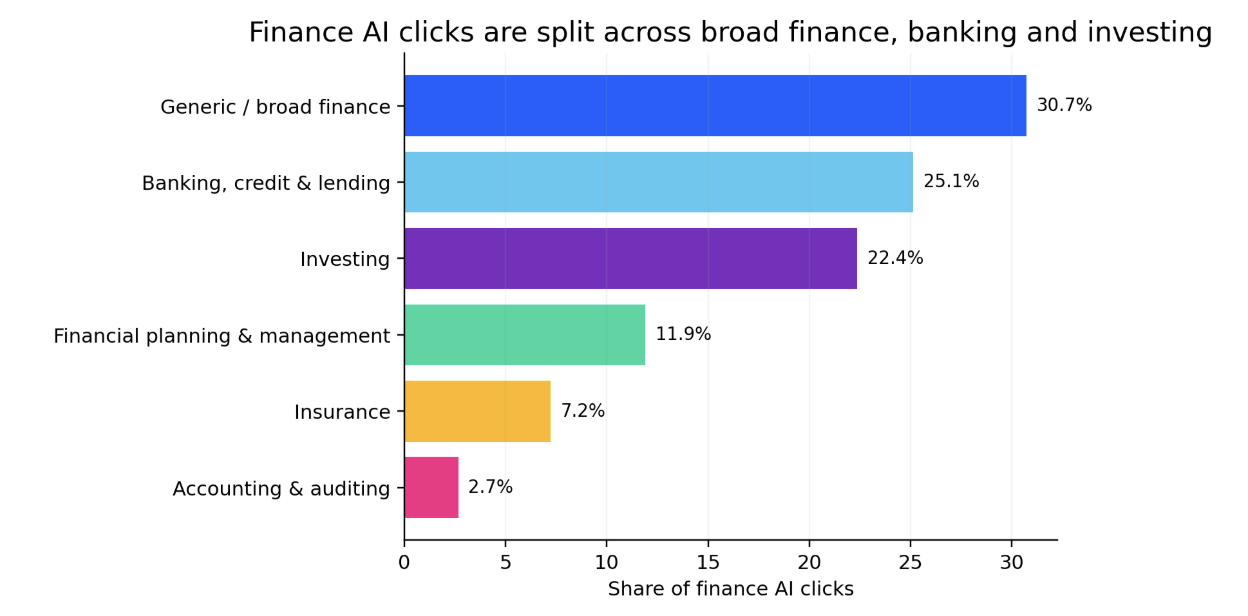
Figure 4. Finance sub-category breakdown by share of AI search clicks across the 10 markets.
| Sub-category | Share of finance clicks |
| Generic / broad finance | 30.7% |
| Banking, credit & lending | 25.1% |
| Investing | 22.4% |
| Financial planning & management | 11.9% |
| Insurance | 7.2% |
| Accounting & auditing | 2.7% |
One of the most interesting findings in the entire dataset is buried in this breakdown: investing at 22.4% of finance clicks.
AI platforms are sending substantial click volume to investing tools, charts, broker platforms, and market-data environments.
A reasonable reading is that users may be relying on AI for market explainers and lookups, then clicking through when they need charts, prices, broker environments, or deeper market data.
Notable investing/market-data players in the dataset include TradingView (top 20 across all 10 markets), Investing.com (top 20 in 9 markets), Schwab and Fidelity (US), DEGIRO (Netherlands), Boursorama (France), Finecobank (Italy), and the broker platforms inside Mexico and Brazil.
For investing platforms, AI search is already a meaningful click producing discovery channel, and one of the finance categories where the click-through is high enough to matter.
Pattern 5: Travel is fragmented at the discovery layer, but more concentrated at the booking and infrastructure layer
The headline that “travel is fragmented” is right at the aggregate level, but it hides a useful split inside the vertical.
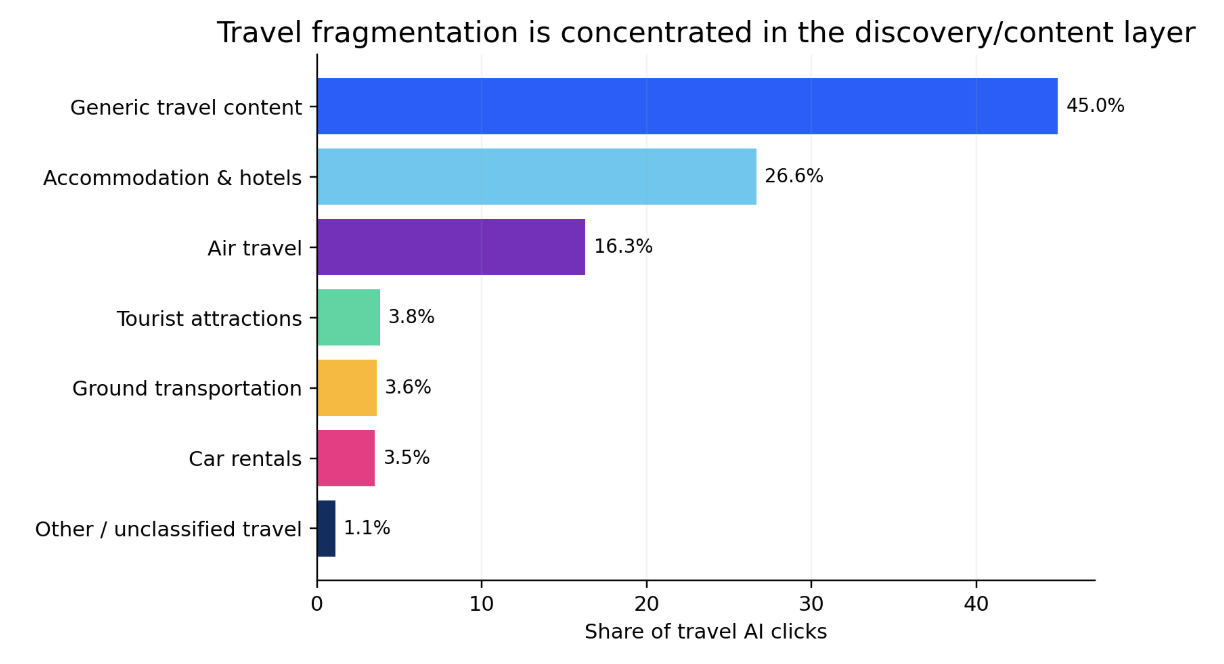
Figure 5. Travel sub-category breakdown by share of AI search clicks across the 10 markets.
| Sub-category | Share of travel clicks |
| Generic travel content | 44.3% |
| Accommodation & hotels | 26.6% |
| Air travel | 16.3% |
| Tourist attractions | 3.8% |
| Ground transportation | 3.6% |
| Car rentals | 3.5% |
| Other / unclassified travel | 1.8% |
The 44.3% “generic travel” bucket does most of the fragmentation work: it’s destination guides, travel publishers, and broader tourism content. Once you strip it out, the underlying booking and infrastructure patterns become much clearer.
Accommodation is more concentrated than the headline numbers suggest.
Booking, Airbnb, Expedia, and a small number of hotel chains carry most of it. Booking.com appears in the top 20 across all 10 travel markets and is #1 in five (UK, Spain, France, Netherlands, Brazil).
Air travel is dominated by airlines and a handful of metasearch sites.
Skyscanner appears across nearly every market. National airlines carry significant share where they have route concentration; Qantas in Australia, Volaris/Viva Aerobus/Aeromexico in Mexico (three airlines in the top 5), LATAM/Azul in Brazil, EasyJet/Ryanair in Europe.
Ground transportation is hyper-local and infrastructure-led, and this is the single most country-specific layer of any vertical:
| Market | Top ground transport domain in travel top 20 |
| Germany | bahn.de (#1 in travel) |
| Italy | lefrecce.it (#1) + trenitalia.com (top 3) |
| France | sncf-connect.com + iledefrance-mobilites.fr |
| UK | tfl.gov.uk |
| Netherlands | ns.nl + 9292.nl |
| Spain | renfe.com |
So a more precise statement in this case is: travel is fragmented across discovery, planning, and content, but more concentrated in accommodation, air travel, and especially transportation infrastructure, and that concentration runs along national rather than global lines.
So what does this actually mean for AI search strategy?
Here are a few practical implications from these AI search traffic trends, especially for brands operating across multiple markets and verticals:
1. Stop treating AI search as a single optimization problem.
The right strategy in Italian ecommerce (where two domains capture more than half of the head) is structurally different from the right strategy in UK travel (where 129 domains share the same cumulative share). The first one is about marketplace presence and reseller control. The second is about content authority and citation density.
2. Audit local champions before investing in any non-US market.
The biggest mistake I keep seeing is brands assuming their global domain authority will carry into a market where a local champion already holds the structured-inventory position.
The audit question isn’t “what’s our domain authority”; it’s “who currently holds the operational data, structured inventory, or institutional trust that AI needs to answer my category’s tasks in this market.”
If the answer is a local infrastructure player, your strategy needs to be built around that fact.
3. Localization needs to extend into entity presence and structured data, not just translation.
Translating product pages won’t help you beat a national rail operator at route queries. The work that does help: making sure your entity is correctly represented in local knowledge graphs, your structured data covers the operational signals that matter (inventory, pricing, availability, hours, locations), and you have local third-party citation density in the publications and directories AI surfaces actually draw from.
4. Measure AI search movement, not static snapshots.
A top 15 domain trending -25% MoM is in more strategic trouble than a top 50 domain trending flat.
The volatility inside the top 50 is where positions are actively being lost, and a quarterly snapshot won’t catch it.
5. For brands inside concentrated heads, accept the structural reality and play your actual game.
If you’re an OTA in Germany, you’re not going to outrank Bahn for rail intent. That’s fine, Bahn doesn’t compete with you for accommodation intent either.
The play is to win cleanly on the queries where your structured offering is genuinely the strongest, not to fight the operator on its own ground.
6. Separate AI visibility from traffic ownership and business impact
One of the clearest implications of this data is that AI visibility and AI referral ownership are not always the same thing.
AI assistants can mention or recommend your brand while sending the measurable click to Amazon, Bol.com, MercadoLibre, Booking, a comparison site, a reseller, a public-sector site, a transportation operator, or a publisher. That is especially important for ecommerce and travel, where the domain receiving the click may not be the brand the user ultimately evaluates or buys from.
This means AI search measurement needs to go beyond “are we mentioned?” and separate three questions:
- Presence: Are we appearing, cited, linked, recommended, and represented accurately?
- Readiness: Are we structurally prepared to be surfaced directly, or are stronger source ecosystems owning the answer?
- Business Impact: Who receives the visit, captures the lead, owns the customer relationship, and gets measurable value?
This is why I recommend measuring AI search through three connected layers, Presence, Readiness, and Business Impact, rather than relying on a single visibility or traffic metric. I explain the full framework, including the KPIs and measurement setup for each layer, in my guide: A 3 Layer Framework to Measure AI Presence, Readiness and Business Impact: Redefining Metrics for the AI Search Era.
For ecommerce brands especially, this changes attribution, margin, CRM capture, retargeting, and customer ownership. A brand can win visibility but lose the click. It can be recommended but not cited. It can influence the decision but see the conversion attributed to direct, branded search, a marketplace, or a reseller.
So the strategic question isn’t only whether AI search includes your brand. It is whether your brand is visible, structurally eligible to receive the click, and able to turn that visibility into measurable business value.
The 10 Markets AI Search Traffic reference
For SEOs working internationally, the cross-vertical patterns above only get you part of the way. Here’s how each market actually breaks down in terms of AI traffic.
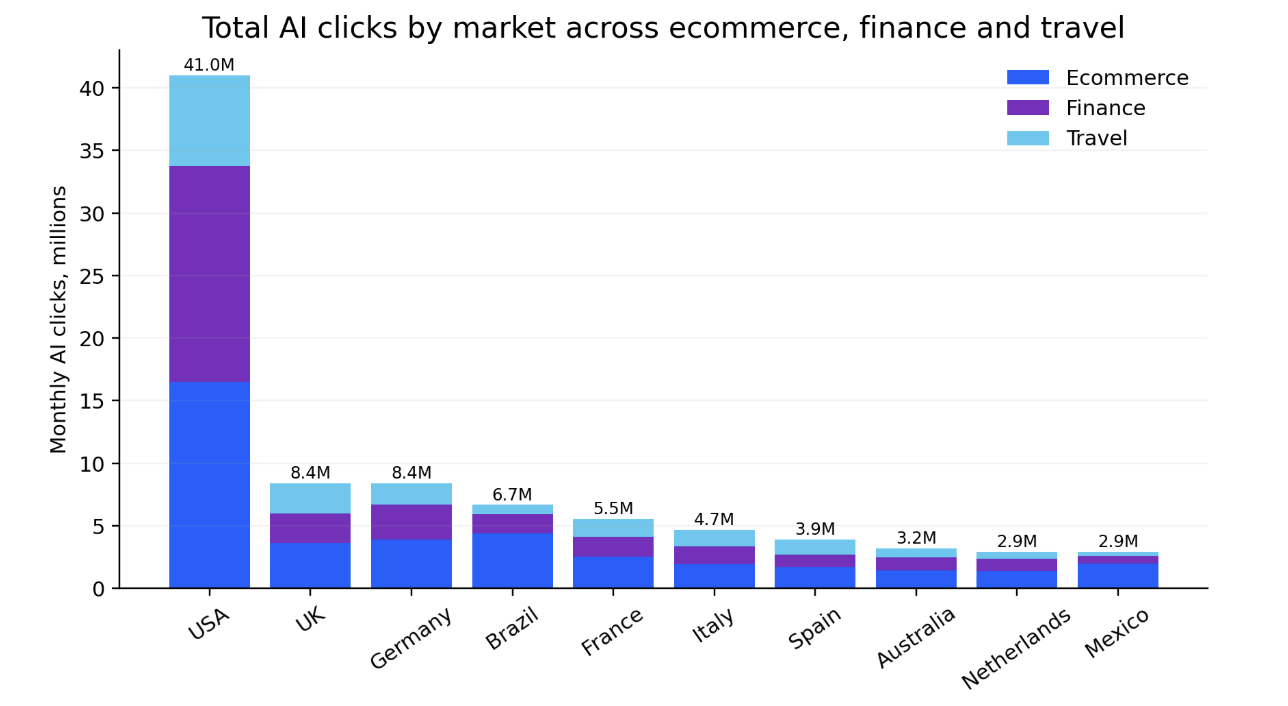
Figure 6. Total AI search clicks by market across ecommerce, finance, and travel.
Total AI clicks across the three verticals per market:
| Rank | Market | Total | Ecommerce | Finance | Travel |
| 1 | USA | 41.0M | 16.5M | 17.3M | 7.2M |
| 2 | UK | 8.4M | 3.6M | 2.4M | 2.4M |
| 3 | Germany | 8.4M | 3.9M | 2.8M | 1.7M |
| 4 | Brazil | 6.7M | 4.4M | 1.6M | 0.7M |
| 5 | France | 5.5M | 2.5M | 1.6M | 1.4M |
| 6 | Italy | 4.7M | 1.9M | 1.4M | 1.3M |
| 7 | Spain | 3.9M | 1.7M | 1.0M | 1.2M |
| 8 | Australia | 3.2M | 1.4M | 1.1M | 0.7M |
| 9 | Netherlands | 2.9M | 1.4M | 1.0M | 0.6M |
| 10 | Mexico | 2.9M | 2.0M | 0.6M | 0.3M |
Brazil is the standout non-US market. Its total AI traffic across the three verticals is higher than France, Italy, Spain, Australia, the Netherlands, and Mexico, and its ecommerce alone is bigger than Germany’s. Brazil should not be treated as a secondary AI search market, especially for ecommerce.
1. USA
| Vertical | Visits | #1 domain | #1 share | Top-10 share |
| Ecommerce | 16.5M | amazon.com | 28.0% | 73.4% |
| Finance | 17.3M | citi.com | 11.9% | 40.1% |
| Travel | 7.2M | expedia.com | 3.5% | 22.2% |
What stands out:
The USA is the largest market in the dataset and one of the most segmented across verticals. Ecommerce is heavily Amazon-led, with Walmart, eBay, Target, and Etsy in the head. Finance fragments across banking, payments, tax, and brokerage. Travel is highly fragmented, led by Expedia, Marriott, Airbnb, Avis, and Booking rather than one dominant winner.
Strategic implication:
Do not optimize the USA as a single AI search market. The stronger approach is vertical-by-vertical and sub-category-by-sub-category, because the ecommerce, finance, and travel click layers behave very differently.
2. UK
| Vertical | Visits | #1 domain | #1 share | Top-10 share |
| Ecommerce | 3.6M | amazon.co.uk | 27.4% | 61.4% |
| Finance | 2.4M | stripe.com | 13.9% | 29.1% |
| Travel | 2.4M | booking.com | 3.4% | 17.5% |
What stands out:
The UK has the most fragmented finance and travel markets in the dataset: 57 domains are needed for 50% of finance clicks and 129 for travel. Finance is supported by strong publishing and comparison surfaces such as FT, MoneySavingExpert, This Is Money, and Trustpilot, while ecommerce remains marketplace-led with a meaningful local retailer layer.
Strategic implication:
The UK appears to reward content quality, comparison, and editorial trust signals more than many other markets in this dataset, especially outside ecommerce.
3. Germany
| Vertical | Visits | #1 domain | #1 share | Top-10 share |
| Ecommerce | 3.9M | amazon.de | 31.4% | 67.2% |
| Finance | 2.8M | paypal.com | 18.2% | 44.9% |
| Travel | 1.7M | bahn.de | 6.4% | 24.5% |
What stands out:
Germany has a strong decision-support layer. Ecommerce includes classifieds, price comparison, and deal communities in the top tier. Finance includes comparison, business publishing, and insurance/health players. Travel is led by Bahn, with city sites also carrying destination intent.
Strategic implication:
For Germany, AI search strategy should account for comparison, deal, classifieds, and infrastructure surfaces rather than assuming a simple global brand or marketplace only model.
4. Brazil
| Vertical | Visits | #1 domain | #1 share | Top-10 share |
| Ecommerce | 4.4M | mercadolivre.com.br | 20.7% | 70.1% |
| Finance | 1.6M | stripe.com | 17.5% | 41.2% |
| Travel | 0.7M | booking.com | 11.1% | 45.2% |
What stands out:
Brazil is the largest non-US ecommerce AI market in the dataset. MercadoLivre clearly beats Amazon, Shopee is a major presence, and local financial institutions, fintechs, credit-data providers, and financial publishers carry meaningful finance share. Travel has an unusual mix that includes ride-hailing, accommodation, airlines, and OTAs.
Strategic implication:
Brazil should not be treated as a US-localized market. The data points to a Portuguese-first ecosystem shaped by local marketplaces, fintechs, banks, airlines, and consumer platforms.
5. France
| Vertical | Visits | #1 domain | #1 share | Top-10 share |
| Ecommerce | 2.5M | amazon.fr | 28.6% | 62.6% |
| Finance | 1.6M | stripe.com | 17.6% | 52.2% |
| Travel | 1.4M | booking.com | 5.3% | 23.1% |
What stands out:
France has the strongest institutional and public-sector presence in the dataset across finance and travel, including ameli.fr, CAF, paris.fr, sncf-connect.com, and iledefrance-mobilites.fr. Ecommerce also has a distinctive classifieds layer through Leboncoin alongside Amazon.
Strategic implication:
For France, optimization should include presence in or alongside official sources, institutional entities, transport infrastructure, and local commercial platforms.
6. Italy
| Vertical | Visits | #1 domain | #1 share | Top-10 share |
| Ecommerce | 1.9M | amazon.it | 46.2% | 76.2% |
| Finance | 1.4M | paypal.com | 13.4% | 47.1% |
| Travel | 1.3M | lefrecce.it | 11.3% | 35.9% |
What stands out:
Italy is the most concentrated ecommerce market in the dataset. Amazon.it captures 46.2% on its own, and adding Temu pushes the top two past 54% of all AI ecommerce clicks. Travel is rail-led to an unusual degree through Lefrecce and Trenitalia.
Strategic implication:
Italian ecommerce strategy is heavily marketplace-led, while Italian travel strategy should account for rail-route-specific content, transport infrastructure, and accommodation visibility.
7. Spain
| Vertical | Visits | #1 domain | #1 share | Top-10 share |
| Ecommerce | 1.7M | amazon.es | 27.3% | 57.0% |
| Finance | 1.0M | stripe.com | 15.4% | 41.3% |
| Travel | 1.2M | booking.com | 4.3% | 25.0% |
What stands out:
Spain shows strong resale and classifieds activity, with Wallapop acting as a top-tier ecommerce destination rather than a niche player. Deal communities, rail, attractions, and city/regional public-sector sites also appear meaningfully in the click layer.
Strategic implication:
Spain rewards local marketplace presence, deal/comparison surfaces, attractions, rail visibility, and city/regional public-sector citations more than a purely commercial or global-domain strategy.
8. Australia
| Vertical | Visits | #1 domain | #1 share | Top-10 share |
| Ecommerce | 1.4M | amazon.com.au | 21.3% | 53.8% |
| Finance | 1.1M | stripe.com | 16.9% | 36.7% |
| Travel | 0.7M | travelandtourworld.com | 9.7% | 34.7% |
What stands out:
Australia shows weaker Amazon dominance than several European markets, with local retail, Shop.app, major banks, airlines, loyalty programs, and Uber all visible in the click layer.
Strategic implication:
Australia requires a strategy that accounts for local retailers, Shopify ecosystem visibility, bank-specific entity signals, and airline-direct content around routes, loyalty, and baggage.
9. Netherlands
| Vertical | Visits | #1 domain | #1 share | Top-10 share |
| Ecommerce | 1.4M | bol.com | 17.9% | 48.6% |
| Finance | 1.0M | stripe.com | 26.8% | 54.0% |
| Travel | 0.6M | booking.com | 5.4% | 23.5% |
What stands out:
The Netherlands is one of the clearest examples of local champions outperforming global defaults. Bol.com beats Amazon.nl, while Coolblue, Tweakers, Marktplaats, and Hema carry meaningful ecommerce share. Finance has the highest Stripe share in the dataset, alongside public-sector visibility from Belastingdienst. Travel includes strong domestic/local players such as Landal, Natuurhuisje, NS, and 9292.
Strategic implication:
The Netherlands is one of the markets most likely to penalize a generic international strategy. Local champions have defensible head share, and localization cannot be reduced to translation.
10. Mexico
| Vertical | Visits | #1 domain | #1 share | Top-10 share |
| Ecommerce | 2.0M | amazon.com.mx | 20.6% | 68.4% |
| Finance | 0.6M | stripe.com | 29.1% | 55.2% |
| Travel | 0.3M | airbnb.mx | 8.0% | 48.3% |
What stands out:
Mexico is the most concentrated travel market in the dataset, with only 11 domains needed for 50% of travel clicks. Airline-direct visibility is strong, with Volaris, Viva Aerobus, and Aeromexico all in the top 5. Ecommerce is also distinctive because Amazon and MercadoLibre compete closely at the top.
Strategic implication:
Mexico requires dual marketplace optimization across Amazon and MercadoLibre, payment-rail awareness around Stripe and Mercado Pago, and airline-direct visibility for travel.
The AI search strategic question for 2026
The most useful reframing I can offer is this: stop asking “how do I optimize for AI search” as a single global question, and start asking “who currently holds the structured answer for my category in each of my markets, and is my position growing or eroding inside that structure.”
That question has a real answer in every market and every vertical. It’s usually not the same answer as the global default. And it’s the answer that determines whether your AI search strategy in that market should be built around competing with the local infrastructure, working alongside it, or shifting your focus to a different layer of the journey entirely.
The “translate, hreflang, and brand-direct” model of international AI search optimization is unlikely to be enough on its own. The data is already pointing in that direction.


