I’ve analyzed the biggest US domain level visibility shifts in Sistrix, along with the top keyword changes behind them, using a two-week measurement window from March 26 to April 11, 2026, which includes the rollout period of the March 2026 core update from March 27 to April 8, to identify any recurring patterns.
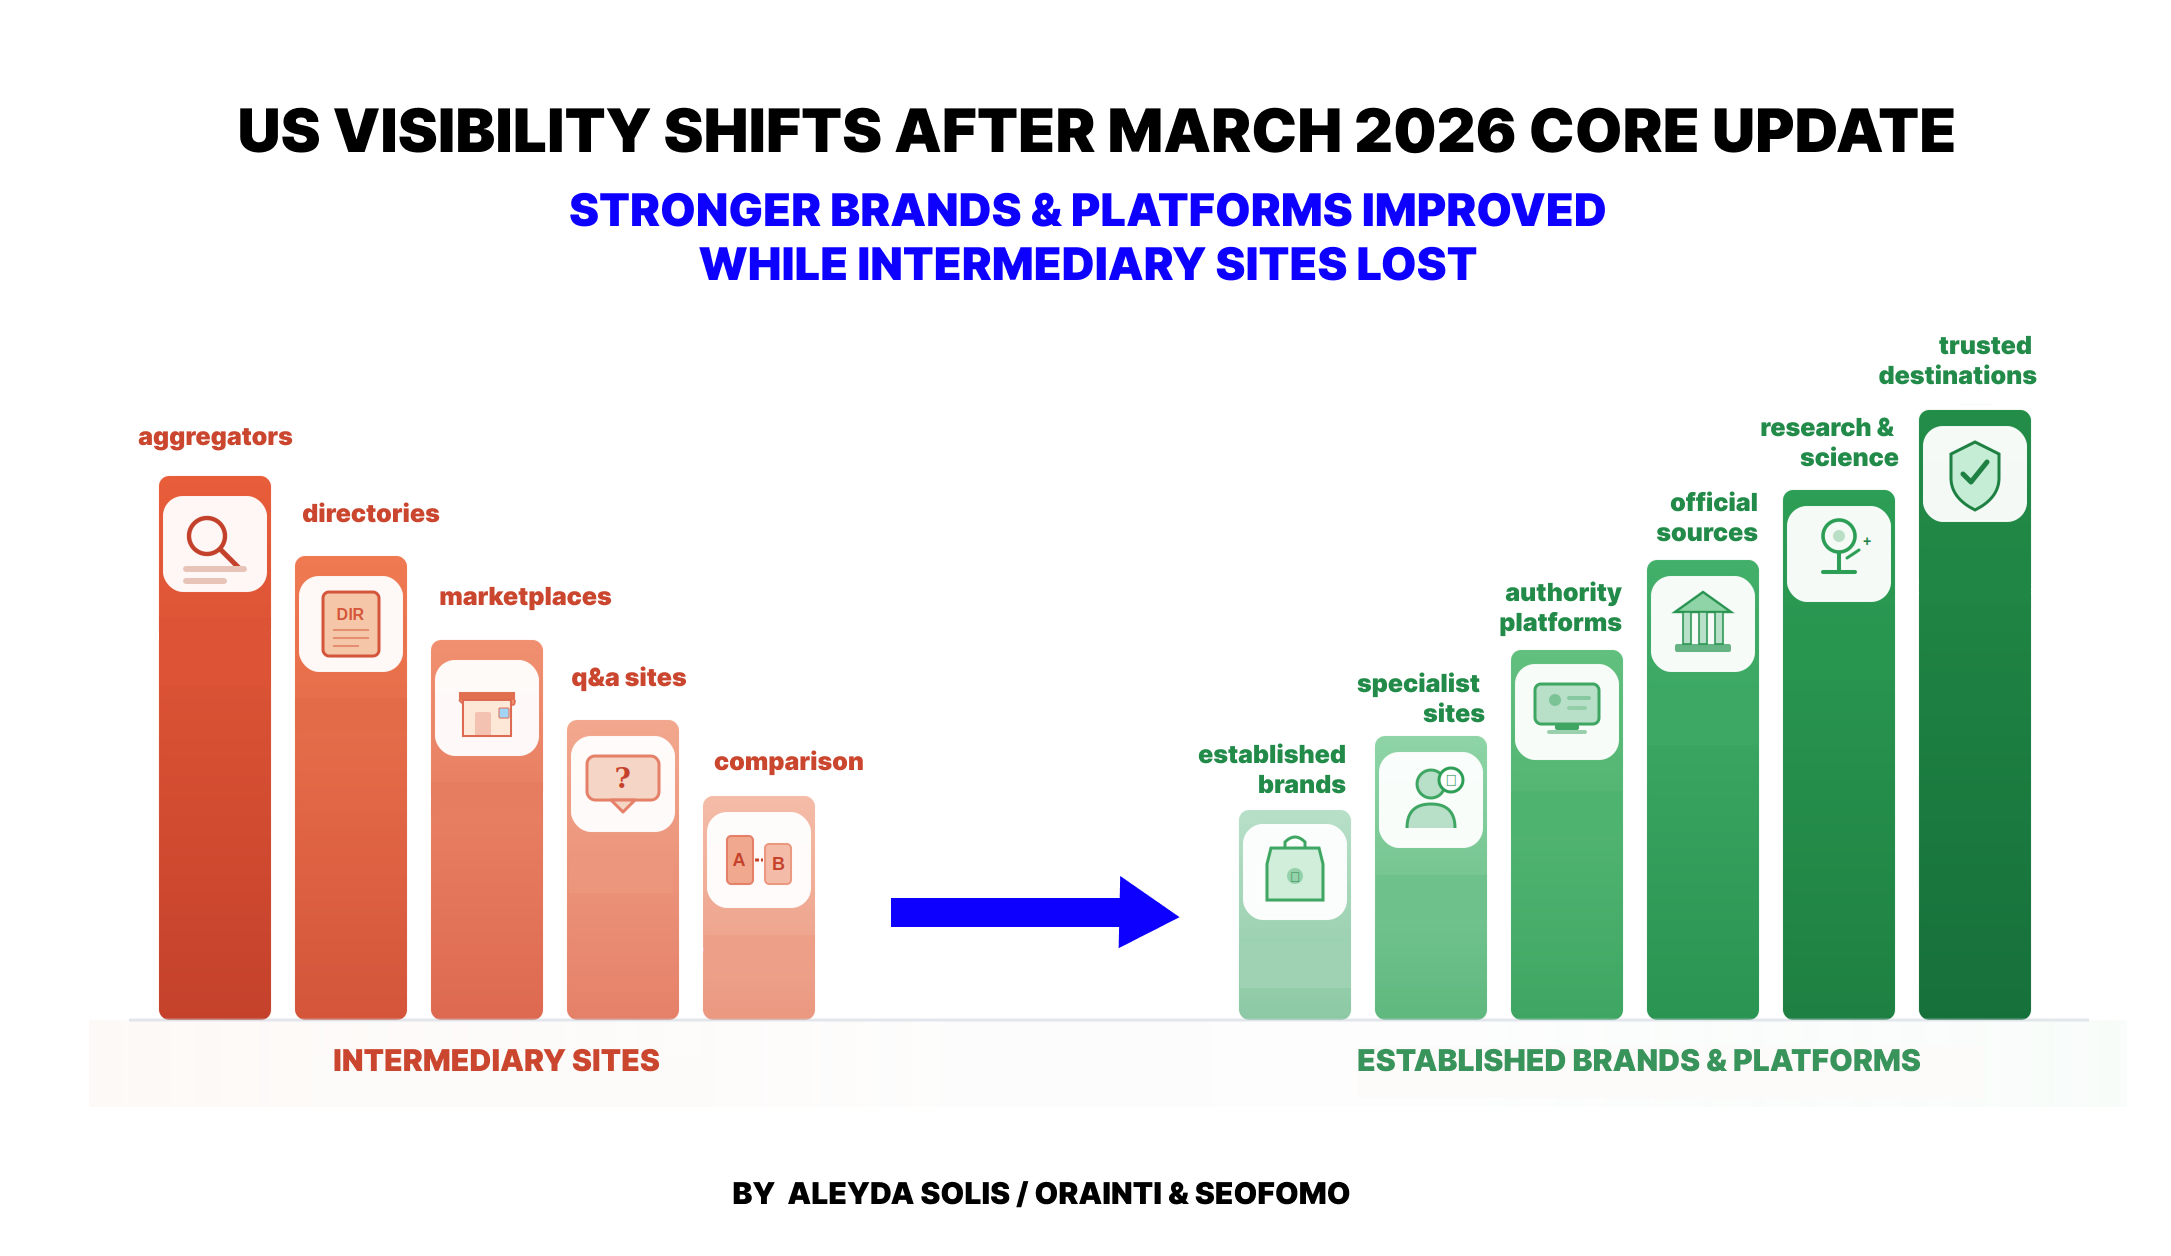
One of the clearest early patterns was a shift away from many intermediary, aggregator, directory, and quick-answer utility sites, and toward a smaller set of stronger destination brands, institutional sources, specialist sites, and dominant platforms.
In other words, visibility often tended to consolidate around the destinations that looked more direct, more established, more trusted, or simply like a stronger fit for the query.
- This was especially visible in dictionaries and language-reference search, where sites like Wiktionary (-21.3%), Collins Dictionary (-30.0%), Etymonline (-36.0%), OneLook (-52.8%), and AcronymFinder (-54.1%) all declined. At the same time, visibility around those same keyword sets often shifted toward stronger reference destinations such as Merriam-Webster, Wikipedia, Cambridge, Dictionary.com, and other large platforms competing on short, broad, or ambiguous queries.
- A similar pattern appeared in jobs, where broad intermediaries such as ZipRecruiter (-36.6%), Glassdoor (-36.3%), and SimplyHired (-43.2%) lost visibility, while more direct or specialized destinations such as Amazon.jobs (+242.7%), myworkdayjobs.com (+115.0%), HigherEdJobs (+79.1%), and USAJobs (+25.5%) gained.
- In government and public-sector search, official domains including Census.gov (+30.2%), BLS.gov (+26.8%), HUD (+36.2%), CISA (+101.2%), and WHO (+21.7%) saw strong gains, especially on fact-heavy, data-led, and trust-sensitive queries.
- In travel, several broad planning and discovery players such as Expedia (-23.4%), Travelocity (-44.3%), and Hotwire (-36.0%) declined, while increases were redistributed across a mixed set of stronger travel brands, suppliers, large travel platforms, and dominant horizontal destinations.
- In real estate, listing heavy and rental directory sites such as Apartments.com (-24.8%), Apartment Guide (-56.2%), Apartment Finder (-43.2%), and Rent.com (-37.3%) lost visibility, while stronger destination platforms such as Zillow (+5.8%) and Opendoor (+136.0%) gained.
- Health was more mixed and more nuanced. Several broad consumer-health, provider-directory, and general medical reference sites, including Healthgrades (-43.5%), Verywell Health (-26.3%), Merck Manuals (-37.8%), WebMD (-16.9%), and Cleveland Clinic (-5.8%), lost visibility, while more specialist, research-led, clinically anchored, or professionally oriented sources such as NEJM (+107.3%), Nature (+41.0%), MSKCC (+34.2%), GoodRx (+69.0%), and Medscape (+32.0%) gained. Rather than a simple authority-led uplift, health looks more like a source-type re-sorting shaped by query fit.
- Other verticals, such as finance and ecommerce, were less clean but still directionally consistent. In both, the broad comparison, marketplace, or interchangeable discovery layer looked more vulnerable, while visibility tended to concentrate around stronger brands, more established destinations, larger platforms, and sites with a clearer claim on the query.
Overall, the clearest takeaway is that visibility often concentrated around fewer, stronger destinations: official sources, specialist sites, well-established brands, and dominant platforms.
One notable exception was YouTube.com, which showed the single largest absolute visibility loss in the dataset (-24.7%, or more than 1,058 Visibility points lost).
Let’s go through the biggest shifts by vertical.
1. Dictionary, translation, and language-reference sites were among the clearest loser clusters
The concentration of losing domains in this category is much higher than in most others. Short answer and ambiguous lexical intent looked especially vulnerable in the update.
Looking beyond the domain-level drops and into the sites that gained across the same declining keyword sets adds useful context. For the top keywords where Collins Dictionary, Oxford Learner’s Dictionaries, and Wiktionary lost visibility, the most consistent winners were other major language and reference destinations, especially Merriam-Webster, Wikipedia, Cambridge, Dictionary.com, Thesaurus.com, and Vocabulary.com. At the same time, very large platforms such as YouTube, Facebook, Reddit, Google, and Instagram also appeared repeatedly among the gaining domains.
That is important because it suggests the visibility didn’t simply disappear from dictionary and language reference sites. Instead, it appears to have shifted in two directions: toward a smaller set of stronger reference destinations, and toward dominant platforms that can compete on short, broad, or ambiguous queries.
The presence of more entity specific winners such as IRS.gov, Reuters, IMDb, and Spotify reinforces that many of the affected terms were not only quick-answer lookups, but also short head terms with multiple possible interpretations.
Taken together with the keyword-level losses, this makes the pattern more convincing. These sites were not just overrepresented among losers at the domain level; they were also losing visibility on the same kinds of queries, and often to the same kinds of competing destinations.
| DOMAIN | DIRECTION | MAR 26 | APR 11 | % CHANGE |
| collinsdictionary.com | ▼ Down | 173.680 | 121.602 | -30.0% |
| oxfordlearnersdictionaries.com | ▼ Down | 72.064 | 55.043 | -23.6% |
| wiktionary.org | ▼ Down | 208.992 | 164.568 | -21.3% |
| etymonline.com | ▼ Down | 51.073 | 32.675 | -36.0% |
| wordreference.com | ▼ Down | 37.652 | 27.118 | -28.0% |
| thefreedictionary.com | ▼ Down | 17.262 | 12.623 | -26.9% |
| yourdictionary.com | ▼ Down | 22.144 | 16.470 | -25.6% |
| wordhippo.com | ▼ Down | 22.555 | 17.158 | -23.9% |
| spanishdict.com | ▼ Down | 27.539 | 20.820 | -24.4% |
| ldoceonline.com | ▼ Down | 17.360 | 11.796 | -32.1% |
| onelook.com | ▼ Down | 9.164 | 4.321 | -52.8% |
| acronymfinder.com | ▼ Down | 2.204 | 1.011 | -54.1% |
| glosbe.com | ▼ Down | 2.711 | 1.613 | -40.5% |
| imtranslator.net | ▼ Down | 1.640 | 1.014 | -38.2% |
2. Travel discovery and planning visibility looked more affected
The data shows a shift within travel, with the biggest losses concentrated around broad planning, comparison, and discovery-type queries<, rather than across the category as a whole.
The declining keyword sets are heavily made up of terms tied to generic travel research and trip-planning intent: broad hotel searches, vacation packages, flights, destination planning, and “things to do” queries. Many of these also sit at the intersection of commercial and informational intent, which is important because it suggests the more affected area was not just booking demand, but the broader layer of travel visibility where users are still exploring, comparing, and narrowing down options.
Looking at the domains that gained across those same keyword sets adds useful context. The visibility didn’t move in just one direction. It shifted to a mix of:
- Direct travel brands and suppliers
- Large established travel platforms and intermediaries
- Big platforms and reference destinations
That matters because the pattern is not simply “intermediaries down, direct brands up.” Some intermediary players also gained.
The broader takeaway is that Google seems to have concentrated visibility around a smaller set of stronger, better-known travel destinations and platforms, whether those were suppliers, major travel brands, or dominant horizontal platforms.
| DOMAIN | DIRECTION | MAR 26 | APR 11 | % CHANGE |
| expedia.com | ▼ Down | 274.288 | 210.126 | -23.4% |
| travelocity.com | ▼ Down | 44.514 | 24.786 | -44.3% |
| hotwire.com | ▼ Down | 18.336 | 11.733 | -36.0% |
| skyscanner.com | ▼ Down | 29.442 | 21.651 | -26.5% |
| orbitz.com | ▼ Down | 10.087 | 7.202 | -28.6% |
| trip.com | ▼ Down | 8.288 | 5.173 | -37.6% |
| lonelyplanet.com | ▼ Down | 19.308 | 13.184 | -31.7% |
| wanderlog.com | ▼ Down | 4.149 | 1.708 | -58.8% |
| visittheusa.com | ▼ Down | 28.100 | 6.951 | -75.3% |
| hotelplanner.com | ▼ Down | 9.168 | 4.874 | -46.8% |
| trivago.com | ▲ Up | 21.666 | 28.575 | +31.9% |
| momondo.com | ▲ Up | 8.870 | 12.752 | +43.8% |
| hotels.com | ▲ Up | 110.171 | 120.692 | +9.6% |
| hilton.com | ▲ Up | 54.128 | 59.513 | +9.9% |
| ihg.com | ▲ Up | 35.589 | 39.102 | +9.9% |
| choicehotels.com | ▲ Up | 14.823 | 17.483 | +17.9% |
| nps.gov | ▲ Up | 85.066 | 98.329 | +15.6% |
3. Jobs showed one of the clearest source-type splits: broad job intermediaries down, more direct or specialized destinations up
This is one of the clearest within-category patterns in the dataset. Broad job-board intermediaries such as ZipRecruiter (-36.6%), Glassdoor (-36.3%), and SimplyHired (-43.2%) lost visibility, while more direct or specialized destinations such as USAJobs (+25.5%), myworkdayjobs.com (+115.0%), HigherEdJobs (+79.1%), and Amazon.jobs (+242.7%) gained.
What makes this pattern especially strong is that the losses were concentrated less around highly specific job queries and more around the broader discovery layer of job search: generic job finding, local hiring, exploratory employer research, and career related intent. In other words, the more affected area was not just “jobs” in general, but the broad intermediary layer that sits between the searcher and the actual employer, application environment, or more specialized destination.
The domain shift data adds another important layer: The visibility lost by these broader intermediaries didn’t move in just one direction. It concentrated around a mix of:
- Stronger general job platforms, especially Indeed
- First-party career destinations and employer connected environments such as Amazon.jobs, Pearson.jobs, Capital One Careers, USPS, and CVS Health
- Specialized or context specific job destinations such as USAJobs, HigherEdJobs, FlexJobs, Remote.co, and Snagajob
- In some cases, large validation or research platforms such as LinkedIn, Reddit, Wikipedia, YouTube, Facebook, and Trustpilot
That matters because the jobs pattern is more nuanced than a simple “aggregators down, official career pages up” story. Some large intermediaries still gained. The broader takeaway is that visibility appears to have consolidated around a smaller set of stronger, more established, more specific, or more trusted destinations for job search.
This makes jobs one of the clearest examples in the dataset of Google pulling visibility away from generic intermediary layers and concentrating it around destinations that are either closer to the hiring source, better aligned with a specific hiring context, or simply stronger known entities in the space.
| DOMAIN | DIRECTION | MAR 26 | APR 11 | % CHANGE |
| ziprecruiter.com | ▼ Down | 63.384 | 40.170 | -36.6% |
| glassdoor.com | ▼ Down | 21.580 | 13.753 | -36.3% |
| simplyhired.com | ▼ Down | 3.563 | 2.023 | -43.2% |
| usajobs.gov | ▲ Up | 10.207 | 12.811 | +25.5% |
| myworkdayjobs.com | ▲ Up | 2.646 | 5.690 | +115.0% |
| higheredjobs.com | ▲ Up | 2.518 | 4.509 | +79.1% |
| amazon.jobs | ▲ Up | 0.766 | 2.626 | +242.7% |
4. Government, public sector, and institutional domains were heavily overrepresented among winners
Official and institutional domains show up again and again among the gainers, which points to a clear shift toward recognized source-of-truth destinations.
The keyword gains from Census.gov and BLS.gov help make that pattern more specific: Their visibility growth was concentrated around highly factual topics: population, demographics, maps, public holidays, unemployment, inflation, salary, occupations, and other job- and data-related queries. These are all query types where users are often looking for a reliable answer, a statistic, or an official reference point, not another interpretive content layer.
That is what makes this pattern especially relevant. It’s not just that government sites gained. It’s that they gained around fact-heavy, data-led, and trust-sensitive queries where an official source is often the strongest fit.
From an SEO perspective, this is a useful reminder of what Google appears to be rewarding more aggressively in these query classes: sources that combine clear authority, strong entity recognition, and a direct relationship to the underlying data or topic itself. That does not mean every government or institutional site wins automatically, but this source type appears to have been favored overall.
So the clearest takeaway here is not simply that public sector sites performed well. It’s that visibility appears to have shifted more toward official sources for factual, statistics driven, and YMYL adjacent searches, where sending users to the primary institutional source is a very plausible quality outcome.
| DOMAIN | DIRECTION | MAR 26 | APR 11 | % CHANGE |
| census.gov | ▲ Up | 26.969 | 35.119 | +30.2% |
| bls.gov | ▲ Up | 39.464 | 50.023 | +26.8% |
| hud.gov | ▲ Up | 13.642 | 18.582 | +36.2% |
| sba.gov | ▲ Up | 17.496 | 21.397 | +22.3% |
| va.gov | ▲ Up | 22.759 | 27.345 | +20.2% |
| energy.gov | ▲ Up | 18.591 | 22.433 | +20.7% |
| ftc.gov | ▲ Up | 17.639 | 21.005 | +19.1% |
| fcc.gov | ▲ Up | 8.806 | 11.393 | +29.4% |
| cisa.gov | ▲ Up | 2.101 | 4.228 | +101.2% |
| dot.gov | ▲ Up | 11.277 | 14.452 | +28.1% |
| aviationweather.gov | ▲ Up | 0.852 | 1.572 | +84.4% |
| usalearning.gov | ▲ Up | 0.648 | 1.369 | +111.2% |
| who.int | ▲ Up | 33.560 | 40.827 | +21.7% |
| un.org | ▲ Up | 15.030 | 19.464 | +29.5% |
| healthdirect.gov.au | ▲ Up | 15.494 | 20.237 | +30.6% |
5. Health was re-sorted by source type
There are clear declines across several broad consumer-health, provider-directory, and general medical reference sites, but the winners aren’t simply “all authoritative health sites.”
Across Healthgrades, Verywell Health, Mayo Clinic, and WebMD, the losses were concentrated around broad, high-volume health queries tied to symptoms, conditions, medications, supplements, side effects, remedies, treatment questions, and provider discovery. The more affected area wasn’t one narrow health niche, but the broader consumer health layer that sits between the user and a medical, institutional, or highly specialized source.
By contrast, the gains in health skewed more toward specialist, research-led, professionally oriented, and clinically anchored sources. That was already visible at the domain level with winners such as Nature (+41.0%), NEJM (+107.3%), MSKCC (+34.2%), Medscape (+32.0%), AAFP (+54.6%), and GoodRx (+69.0%), and Nature’s keyword gains reinforce that this wasn’t mainly about broad symptom explainers, but more specialized or science led informational visibility.
So the clearest takeaway is that health appears to have been sorted more finely by source type and query fit. Broad consumer health publishers, provider directories, and general medical explainers looked more affected, especially on high-volume symptom, condition, medication, supplement, and local-provider queries. Improvements skewed more toward sources that were more institutional, more specialized, more clinically anchored, or simply a stronger fit for that specific kind of health need.
From an SEO perspective, this suggests Google may be differentiating much more aggressively within health based not only on brand recognition, but on the kind of source a site represents and how directly it matches the underlying medical intent. That remains an interpretation, but it fits the mix of winners, losers, and domain shifts much better than a simple “authority won” explanation.
| DOMAIN | DIRECTION | MAR 26 | APR 11 | % CHANGE |
| healthgrades.com | ▼ Down | 8.791 | 4.966 | -43.5% |
| verywellhealth.com | ▼ Down | 12.537 | 9.238 | -26.3% |
| kidshealth.org | ▼ Down | 25.829 | 17.048 | -34.0% |
| rxlist.com | ▼ Down | 3.676 | 2.066 | -43.8% |
| merckmanuals.com | ▼ Down | 17.305 | 10.767 | -37.8% |
| medicinenet.com | ▼ Down | 2.992 | 1.881 | -37.2% |
| nature.com | ▲ Up | 14.316 | 20.188 | +41.0% |
| nejm.org | ▲ Up | 2.207 | 4.574 | +107.3% |
| mskcc.org | ▲ Up | 9.313 | 12.500 | +34.2% |
| medscape.com | ▲ Up | 19.497 | 25.736 | +32.0% |
| cedars-sinai.org | ▲ Up | 11.762 | 14.425 | +22.6% |
| aafp.org | ▲ Up | 6.681 | 10.329 | +54.6% |
| rchsd.org | ▲ Up | 0.608 | 1.953 | +221.4% |
| biorxiv.org | ▲ Up | 0.338 | 1.215 | +260.0% |
| goodrx.com | ▲ Up | 17.626 | 29.784 | +69.0% |
| mayoclinic.org | ▼ Down | 368.832 | 356.294 | -3.4% |
| clevelandclinic.org | ▼ Down | 422.153 | 397.830 | -5.8% |
| medlineplus.gov | ▼ Down | 162.801 | 146.871 | -9.8% |
| webmd.com | ▼ Down | 117.046 | 97.271 | -16.9% |
| hopkinsmedicine.org | ▼ Down | 91.337 | 79.405 | -13.1% |
6. Real estate visibility consolidated around stronger destination platforms
Real estate visibility shifted within the category, especially away from broader listing layer and rental directory models and toward stronger destination platforms.
Both Apartments.com and Homes.com were especially affected on local, high-volume, commercially oriented queries, which is where broad real estate platforms often look the most interchangeable from a search perspective. By contrast, Zillow’s gains were concentrated around many of those same broad real estate and rental intents.
The domain shift data for Apartments.com’s top declining keywords reinforces that pattern. The visibility didn’t move in one single direction, but it did skew toward a mix of stronger category leaders, large platforms, and more specific housing destinations.
So the clearest takeaway here isn’t just that aggregators declined. It’s that broad real estate and rental visibility appears to have consolidated around fewer, stronger category leaders. In this case, Zillow stands out as the clearest beneficiary, which suggests Google may have pulled visibility away from more interchangeable listing-layer experiences and concentrated it around destinations with stronger brand recognition, category gravity, and a clearer role as a starting point for that search journey.
From an SEO perspective, this makes real estate another strong example of a broader pattern: when multiple platforms compete for the same broad discovery intent, visibility seems more likely to concentrate around the destinations that are more established, more recognizable, or more clearly preferred as a category starting point.
| DOMAIN | DIRECTION | MAR 26 | APR 11 | % CHANGE |
| apartments.com | ▼ Down | 58.655 | 44.106 | -24.8% |
| homes.com | ▼ Down | 51.278 | 38.909 | -24.1% |
| apartmentguide.com | ▼ Down | 2.417 | 1.057 | -56.2% |
| apartmentfinder.com | ▼ Down | 2.309 | 1.311 | -43.2% |
| forrent.com | ▼ Down | 1.754 | 1.057 | -39.7% |
| rent.com | ▼ Down | 7.997 | 5.018 | -37.3% |
| crexi.com | ▼ Down | 3.241 | 1.839 | -43.2% |
| roomies.com | ▼ Down | 1.907 | 1.211 | -36.5% |
| zillow.com | ▲ Up | 205.800 | 217.731 | +5.8% |
| opendoor.com | ▲ Up | 0.506 | 1.195 | +136.0% |
7. In finance, broad comparison and marketplace style visibility weakened, while stronger financial destinations gained
Finance points in a similar direction to some of the other verticals, but the pattern is less clear than in dictionaries, jobs, government, or even real estate. There were clear declines across several comparison led, marketplace style, and community or market-data platforms, while some direct financial brands and institutions gained. But unlike other categories, the winners here weren’t all the same type of source.
The sites that declined — especially Credit Karma (-40.6%), LendingClub (-44.0%), and Insurify (-48.0%) — were hit mostly on broad, high-volume finance and comparison queries. In Credit Karma’s case, many of the losses were concentrated around credit card and card-comparison demand.
On the winner side, the gains were spread across a more mixed set of destinations. Some were clearly direct financial brands and institutions, such as American Express (+26.3%), Navy Federal (+27.1%), and America First (+82.4%).
At the same time, the domain shift data for Credit Karma’s top declining keywords shows that the visibility didn’t move only to direct providers. The biggest gainers included a mix of banks and card issuers such as Chase, Bank of America, Citi, Discover, Capital One, and US Bank; finance publishers and comparison brands such as Bankrate, NerdWallet, WalletHub, and U.S. News; and also large validation or discussion platforms such as Reddit, Wikipedia, YouTube, and CNBC.
That matters because it makes the pattern more nuanced than a simple “aggregators down, brands up” story. Some comparison and finance publisher models still gained. The broader takeaway is that visibility seems to have concentrated around a smaller set of stronger financial brands, larger finance destinations, and major platforms that were also competing for the same intent.
| DOMAIN | DIRECTION | MAR 26 | APR 11 | % CHANGE |
| creditkarma.com | ▼ Down | 7.943 | 4.715 | -40.6% |
| lendingclub.com | ▼ Down | 2.100 | 1.175 | -44.0% |
| insurify.com | ▼ Down | 2.539 | 1.320 | -48.0% |
| tradingview.com | ▼ Down | 13.470 | 9.583 | -28.9% |
| macrotrends.net | ▼ Down | 3.008 | 1.896 | -37.0% |
| stocktwits.com | ▼ Down | 2.525 | 1.586 | -37.2% |
| americanexpress.com | ▲ Up | 12.766 | 16.129 | +26.3% |
| navyfederal.org | ▲ Up | 10.571 | 13.439 | +27.1% |
| robinhood.com | ▲ Up | 9.019 | 11.064 | +22.7% |
| americafirst.com | ▲ Up | 0.643 | 1.173 | +82.4% |
8. Ecommerce was mixed, but visibility still tended to concentrate around stronger brands and more clearly defined commercial destinations
Ecommerce is too mixed to reduce to a simple winner/loser story. Large commercial domains appear on both sides of the ledger, and the pattern isn’t as clean as in jobs, government, or dictionaries. Still, there is a directional trend worth calling out.
The improvements were concentrated around brands with clearer product identity, stronger brand pull, or a tighter fit for the query, while many of the declines hit retailers on broader, more interchangeable category demand and third-party brand demand.
The keyword data helps make that clearer. On the winning side, sites like Coach, Hermès, and ASOS gained on a mix of strong branded demand and product/category searches where they had a more obvious destination fit. On the losing side, retailers such as Wayfair, Walmart, Best Buy, and Target were more often hit on broad commercial queries, third-party brand demand, and high-volume product searches where multiple retailers can plausibly compete.
The domain shift data from Best Buy and Target adds an important layer. The visibility they lost didn’t move in one single direction, but it did tend to redistribute toward a mix of:
- Stronger direct brands and manufacturers
- Biggest marketplaces and major retailers
- In some cases, specialist or more query relevant destinations
When the query is broad, product-led, or tied to third-party brand demand, visibility may be more likely to consolidate around the destinations that look more authoritative, more direct, more recognizable, or simply more relevant for that specific commercial intent.
| DOMAIN | DIRECTION | MAR 26 | APR 11 | % CHANGE |
| coach.com | ▲ Up | 2.109 | 4.013 | +90.2% |
| hermes.com | ▲ Up | 0.821 | 1.640 | +99.8% |
| verawang.com | ▲ Up | 0.744 | 1.475 | +98.3% |
| microcenter.com | ▲ Up | 8.463 | 12.752 | +50.7% |
| asos.com | ▲ Up | 8.694 | 10.818 | +24.4% |
| wayfair.com | ▼ Down | 40.765 | 25.505 | -37.4% |
| nastygal.com | ▼ Down | 1.845 | 1.120 | -39.3% |
| saksoff5th.com | ▼ Down | 2.455 | 1.084 | -55.8% |
| anthropologie.com | ▼ Down | 15.042 | 10.219 | -32.1% |
| neweggbusiness.com | ▼ Down | 2.002 | 1.129 | -43.6% |
| amazon.com | ▲ Up | 2166.080 | 2209.443 | +2.0% |
| apple.com | ▲ Up | 314.628 | 364.807 | +15.9% |
| costco.com | ▲ Up | 53.000 | 61.304 | +15.7% |
| ikea.com | ▲ Up | 76.450 | 87.200 | +14.1% |
| menards.com | ▲ Up | 29.717 | 32.601 | +9.7% |
| walmart.com | ▼ Down | 382.498 | 325.997 | -14.8% |
| bestbuy.com | ▼ Down | 194.728 | 172.499 | -11.4% |
| target.com | ▼ Down | 173.153 | 157.758 | -8.9% |
| homedepot.com | ▼ Down | 319.301 | 308.721 | -3.3% |
| lowes.com | ▼ Down | 128.632 | 119.143 | -7.4% |
| nordstrom.com | ▼ Down | 57.818 | 48.565 | -16.0% |
| etsy.com | ▼ Down | 59.514 | 52.777 | -11.3% |
| newegg.com | ▼ Down | 32.105 | 26.040 | -18.9% |
Wrapping Up
Visibility often moved away from more interchangeable intermediary players and concentrated around stronger, clearer destinations: official sources, specialist sites, well-established brands, and dominant platforms that are a better fit for the query.
The key pattern is not just authority. It’s who looks like the most natural place to go for that search. And the implication is straightforward: the more your site sits between the user and the answer, the more exposed it may be. The more it is the destination, the better positioned it seems to be.
Remember to keep updated with the latest Google Updates and search news: Subscribe to the SEOFOMO newsletter for free.

